

Maximum drawdown (MDD) explained: daily vs month-end MDD and recovery time
MDD is the largest drop from a peak. Real numbers show why daily and month-end MDD differ for the same portfolio, and what 23 months and 990 days each measure.
In this guide 6
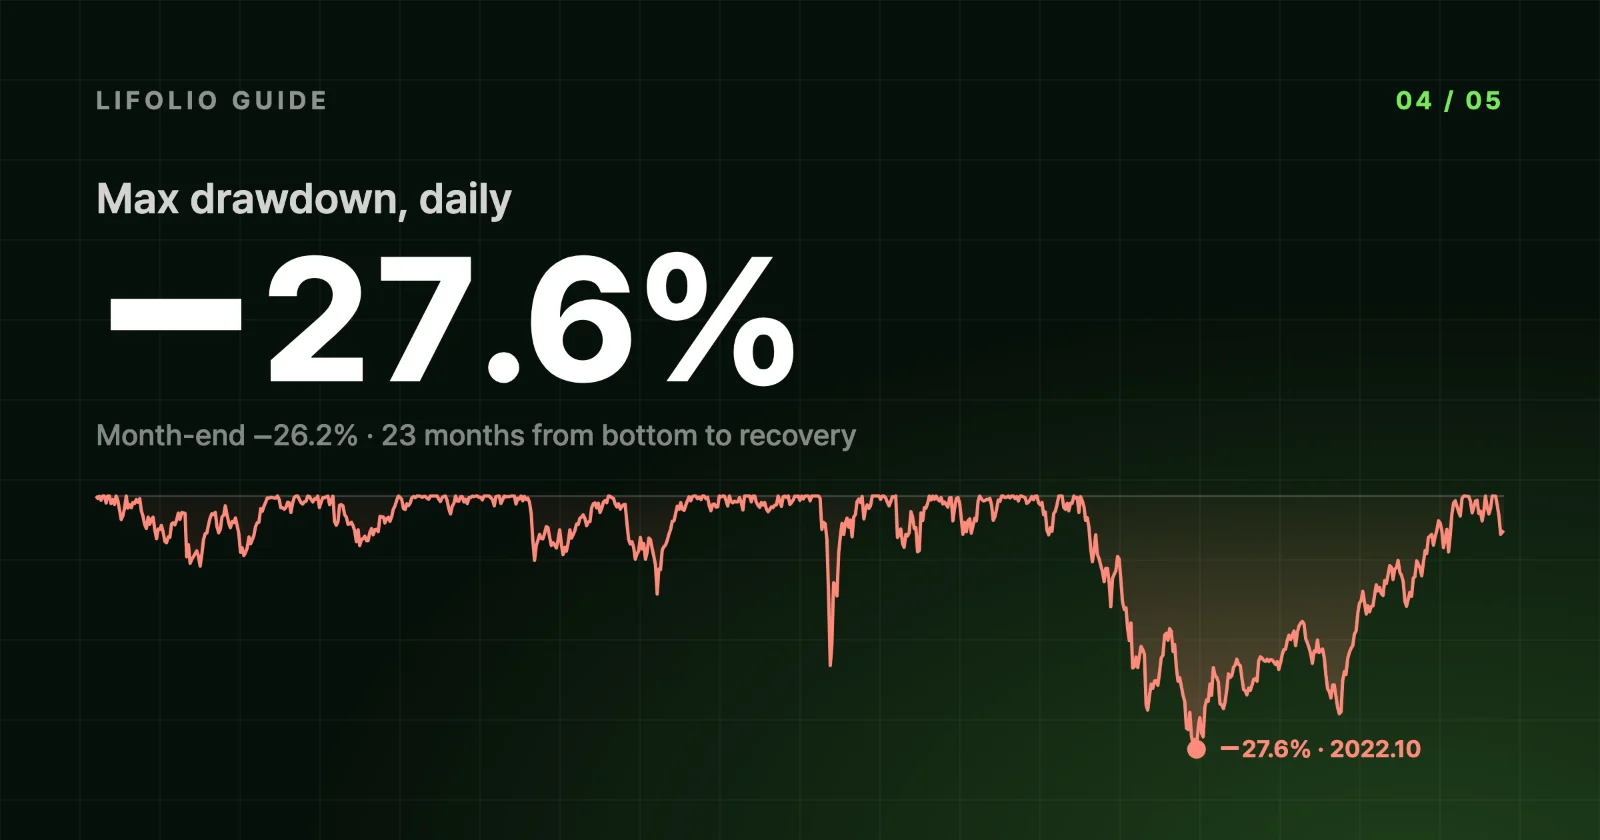
Backtest an SPY 60% · TLT 40% portfolio from 2015 to 2024 and the summary card shows a max drawdown of −27.6%. Open the All metrics window, though, and there is a second max drawdown: Max drawdown · month-end, −26.21%. Same portfolio, same period, different number. Which one is right?
Maximum drawdown (MDD) is the largest percentage drop from a previous high. Both values follow that definition. They differ only in how often the portfolio's value was checked. Recovery time works much the same way: the month count on the summary card and the day counts in the Recovery Timeline measure different stretches of time.
The same drop, checked at different intervals
The formula is the same for both. For each day, work out how far that day's value is below the highest value up to that point, then take the lowest figure over the whole period. The only difference is which days go into the calculation. Both are calculated from a return series with the effect of contributions removed, so adding $500 a month to the same example leaves both values unchanged.
Here is the 2022 decline measured both ways.
| Basis | Peak | Trough | Drawdown |
|---|---|---|---|
| Daily | 2021-12-27 $21,200.37 | 2022-10-20 $15,337.55 | −27.65% |
| Month-end | 2021-12-31 $21,099.70 | 2022-09-30 $15,568.91 | −26.21% |
Both the peak and the trough shift. The value slipped a little in the four days after the daily high, so the month-end peak is the year's last trading day.
The difference at the trough is bigger. The lowest day wasn't a month-end, and eleven days later, at the end of October, the value had climbed back to $15,956. October 2022 was actually an up month, gaining 2.49%. So the month-end trough lands a month earlier.
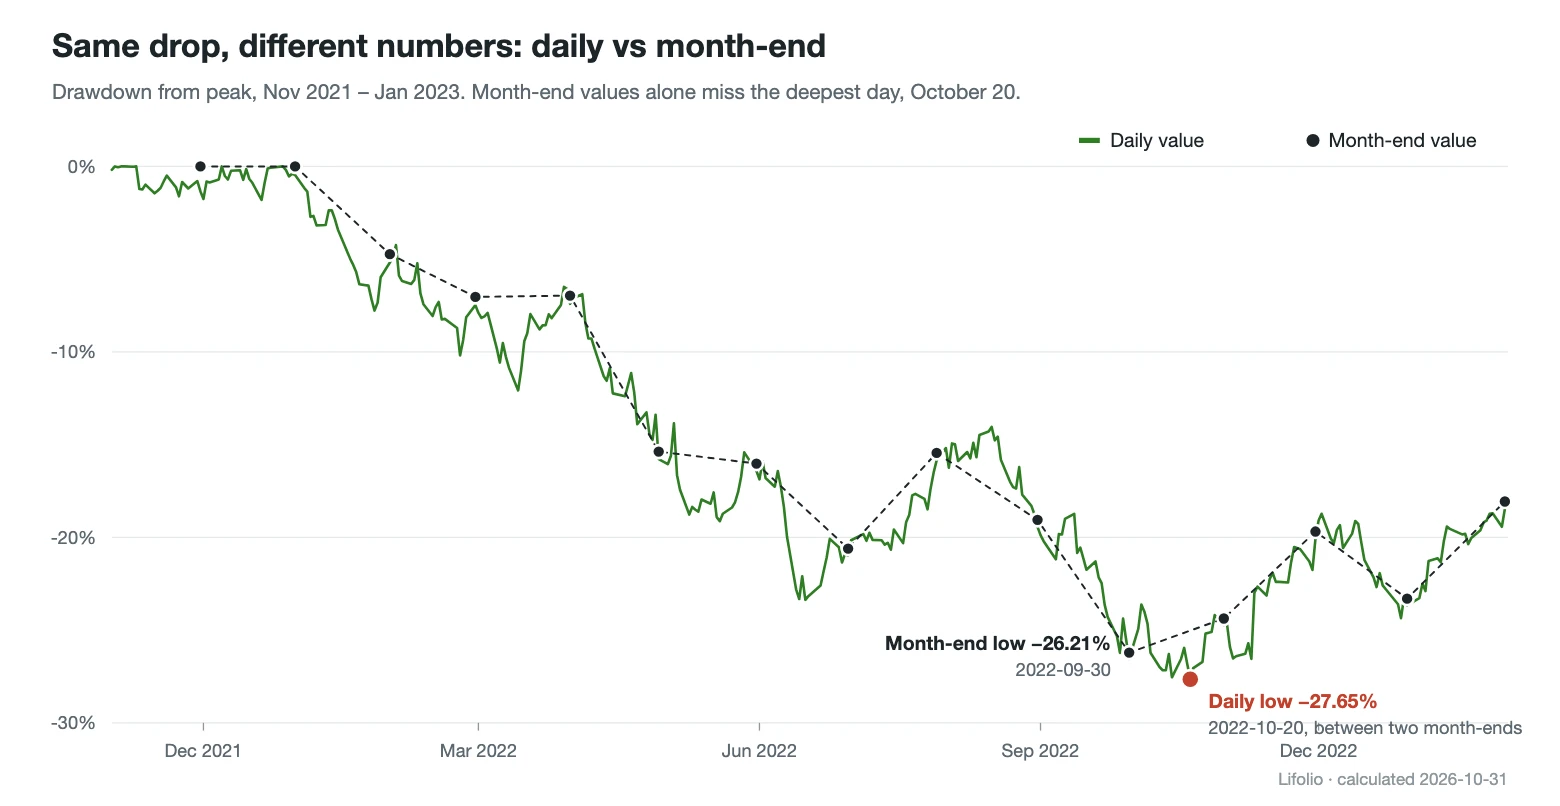
Every month-end value is also one of the daily values. That is why daily MDD can never come out shallower than month-end MDD.
When a drop recovers within the month
The 2022 gap was small because the decline built up slowly over nearly ten months, and a decline that runs for months is mostly captured by month-end values too. Short, sharp drops are a different story. Run the same portfolio for 2015-01-02 to 2021-12-31 and daily MDD is −18.5%, while month-end MDD is just −7.16%.
The daily figure comes from the 2020 COVID crash. The portfolio fell from $16,331 on Feb 20 to $13,309 on Mar 18, in only 27 days, but it rebounded just as quickly. Connect only the month-end values and it went from $15,837 at the end of January to $14,741 at the end of March (−6.92%), then topped the January month-end value at $15,936 at the end of April. Viewed month by month, most of the crash hides between two month-ends.
It even changes which decline looks like the worst. For this period, the month-end MDD comes not from 2020 but from the fourth quarter of 2018, the decline from the end of August to the end of December, which measured −10.71% on a daily basis. Someone looking only at month-end values wouldn't see the March 2020 crash as this portfolio's worst moment.
Open the same example ending in 2021
Before comparing MDD across sites
Backtesting tools don't all measure MDD at the same interval. Portfolio Visualizer says in its FAQ that maximum drawdown is calculated from monthly portfolio balances. The Portfolio Charts drawdowns chart uses inflation-adjusted year-end values and notes that deeper losses may have occurred during the year.
The longer the interval between observations, the shallower the MDD can get; it never gets deeper. When comparing with a source that uses monthly balances, Lifolio's month-end figure is the right match. Inflation-adjusted year-end values don't line up with either of Lifolio's figures.
Which figure to use within Lifolio depends on your question. The daily value is closer to the worst number you would actually have seen in your account while holding, and it's the one the summary card shows. Click the card's info icon and both values appear, the daily one described as "includes intra-month lows, more conservative" and the month-end one as "for monthly performance comparison." Even the daily value is based on closing values, so an intraday drop that recovered before the close is not in either figure.
Three ways to measure recovery time
Back to the 2022 decline. On a daily basis, the peak was Dec 27, 2021, the trough Oct 20, 2022, and the recovery Sep 12, 2024. Recovery is the first day the value gets back to its previous high. Any rebounds before then count as part of the same decline.
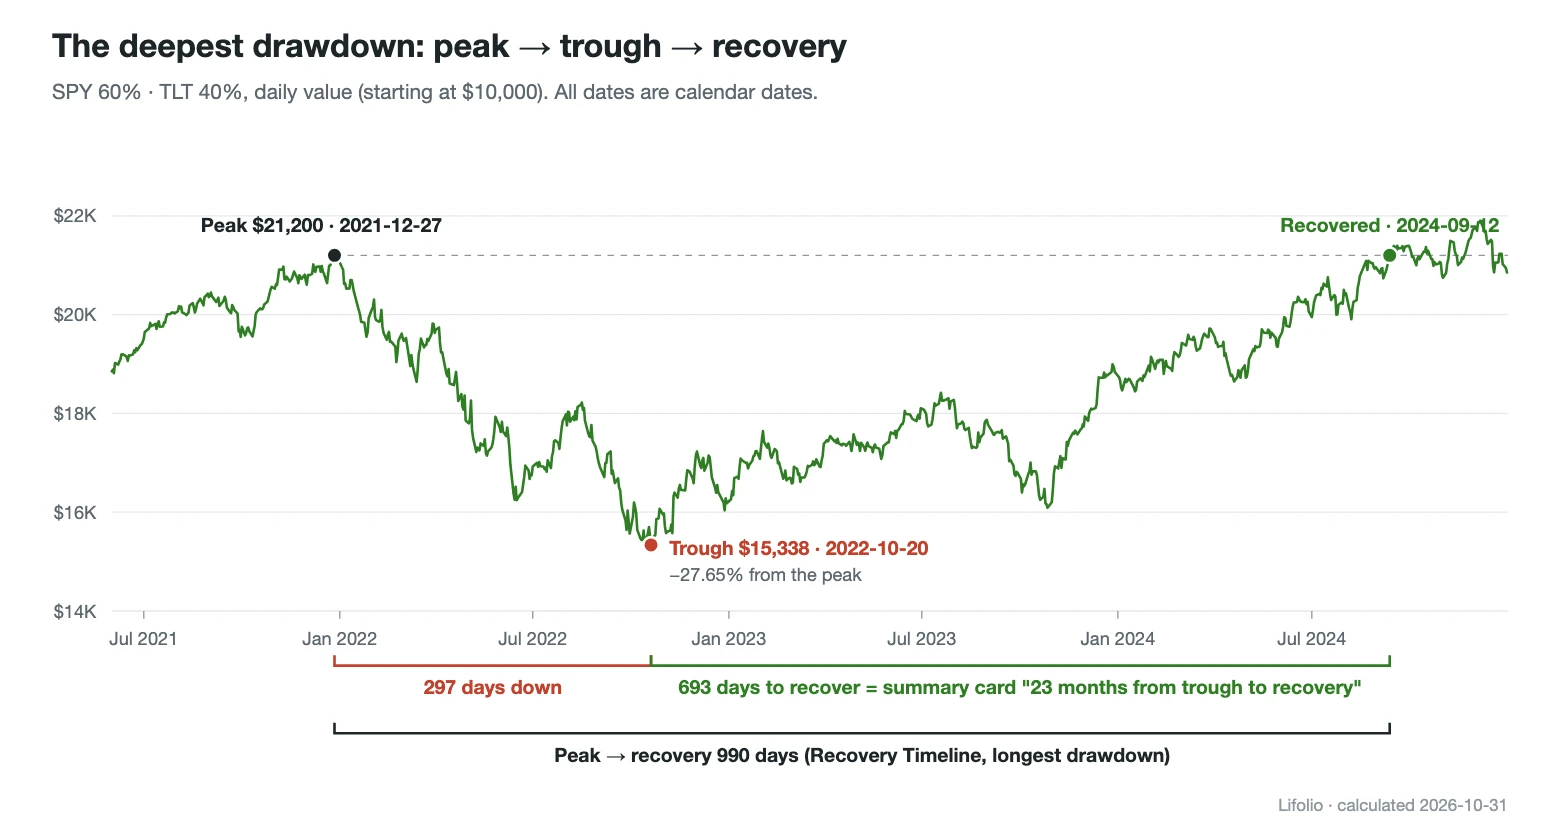
Pair up the three dates and you get three spans. All are counted in calendar days, so weekends and market holidays are included.
- Down, 297 days: from peak to trough
- Recovery, 693 days: from trough to recovery
- Peak→recovery, 990 days: from peak to recovery, the two spans above added together
The summary card's "23 months from trough to recovery" is the second span divided by an average month length of 30.44 days (22.8), rounded. MDD Recovery in the All metrics window shows the same value.
Go by the card alone and you would underestimate the time spent below the peak by about ten months. Someone who invested at the late-2021 peak spent a little over two years and eight months underwater, below that previous high, once the way down is included. That full length is the Peak→recovery day count in the Recovery Timeline. Short definitions are under Maximum drawdown and Recovery time in the metrics glossary.
Median or average recovery time?
The Risk & recovery section opens with a line giving the peak-to-recovery time of the deepest drawdown, as in "990 days from peak to recovery," and below it the Recovery Timeline shows up to five drawdown episodes that exceeded the chosen threshold, deepest first. The Episode Analysis group in the same section gives the median and average recovery time for the episodes that exceeded that threshold. Unlike the summary card, both measure from peak to recovery.
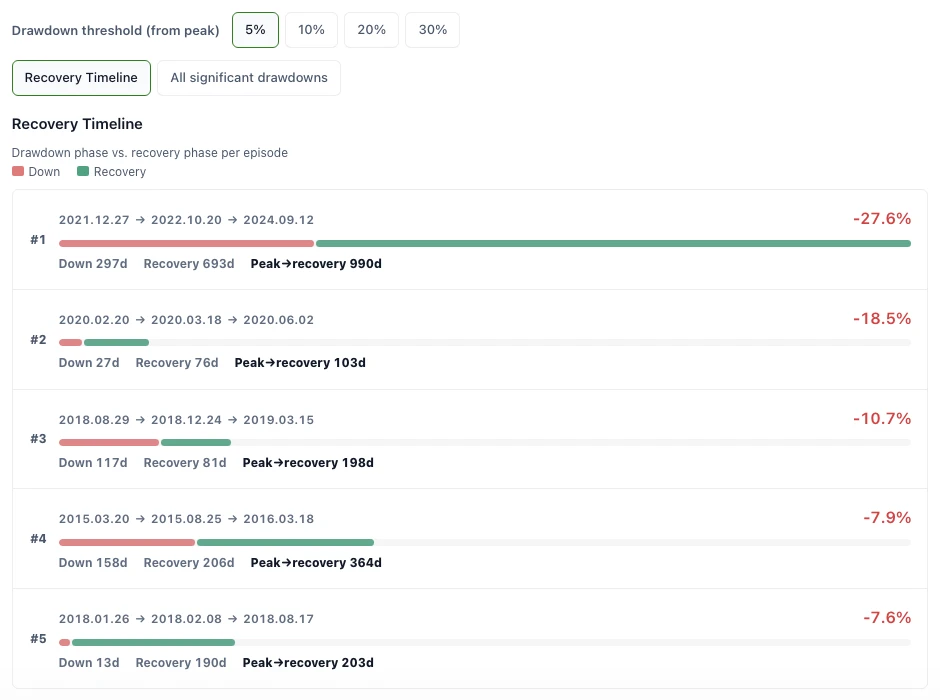
At the default 5% threshold, eight episodes qualify. All of them regained their previous high, so the screen shows "8 completed · 0 unrecovered." The median is 191 days, the average of the two middle episodes (184 and 198 days) when the eight are sorted by length. In other words, during this period a drop of more than 5% typically got back to its high in a little over half a year.
The average is 275 days, almost three months longer, because the single 990-day episode from 2022 pulls it up. Leave that one out and the average drops to about 173 days, while the median barely moves, to 184 days. The median tells you how long a typical decline took, and the gap between the two tells you how much one long decline skewed the result. If the gap is large, start with the top episode in the timeline.
Change the threshold and the episodes being counted change too. At 10% there are 3, at 20% only 2022 remains, and at 30% there are none. Episodes that hadn't regained their peak by the last day of the period are left out of the median and average and counted only as unrecovered, so while a long decline is still under way, the median can look shorter than it really is. In this example the last decline ended at −4.80%, so it doesn't meet the 5% threshold. Either figure comes from a single historical path and can't tell you how long the next recovery will take. These limits are summarized in The limits of backtesting.
Frequently asked questions
What is an acceptable max drawdown?
There is no threshold that works for every portfolio. What you can do is gauge relative depth by putting it next to a benchmark figure calculated on the same basis. In the Key Performance Comparison group of the All metrics window, the SPY benchmark's max drawdown is −23.93% on a month-end basis, against −26.21% for this example on the same month-end basis. Even with 40% in bonds, the portfolio fell further than SPY over this period.
What's the difference between max drawdown and volatility?
Volatility measures how widely monthly returns were spread around their average, converted to an annual figure, so it counts the swings in up months too. MDD looks only at the single deepest decline. This example's volatility is 11.35%, and even when month-to-month swings are modest, MDD can be deep if a decline keeps grinding in one direction for a long time. The calculation is under Volatility in the metrics glossary.
Why is my max drawdown different from another site's?
Start by matching three things: the observation interval, the period and how dividends are treated. The interval is whether daily, monthly or year-end values were used. The period matters a lot: just moving the end date three years earlier makes this example's daily MDD more than 9 points shallower. And whether the calculation uses total return with dividends reinvested or price return alone can also change the size of the drop. This article's example reinvests dividends.
The numbers in this article were verified by running the same settings on lifolio.io on Oct 31, 2026. If you spot an error, please let us know using the Send Feedback button at the bottom right of the screen.