
The limits of backtesting: why the date range you pick changes the result
Ending three years later cut an SPY/TLT portfolio's annualized return from 11.26% to 7.63%. See how the date range, holding period and crises shift backtests.
In this guide 7
Suppose you put $10,000 into 60% SPY and 40% TLT, rebalanced monthly, and held it from the first trading day of 2015 through the end of 2021. Lifolio's results screen hands you a pretty impressive report card: an annualized return of 11.26% and a Sharpe ratio of 1.18. Keep the assets and rules exactly the same, push only the end date out to the end of 2024, and the same portfolio's numbers change like this.
| Backtest period | Annualized return | Max drawdown (daily) | Sharpe ratio |
|---|---|---|---|
| 2015-01-02 to 2021-12-31 | 11.26% | −18.5% | 1.18 |
| 2015-01-02 to 2024-12-31 | 7.63% | −27.65% | 0.55 |
Open the version that ends in 2021
The table values come from the All metrics window on the results screen; the summary cards show only one decimal place. Judged by the first row alone, this mix offers decent returns and a tolerable drawdown. In the second row, the Sharpe ratio, which measures return per unit of risk, is cut by more than half. Just three more years of data, and the verdict changes. A backtest doesn't answer "Is this portfolio good?" It answers "How did this portfolio do over this period?" The full settings, including dividend reinvestment and the benchmark, are in How to read backtest results.
What changes when you add three more years?
The portfolio returned −23.31% in 2022, +16.43% in 2023 and +10.68% in 2024. The last two were good years, but not good enough to make up for everything lost in 2022, so a balance of about $21,100 at the end of 2021 stood at $20,852 at the end of 2024, slightly lower than three years earlier.
The max drawdown deepened because the 2022 decline was bigger than the 2020 COVID-19 crash. The dates of that decline and how long it took to recover are covered separately in MDD on a daily vs month-end basis, and recovery time. Volatility rose from 8.68% to 11.35% while returns fell, so a sharp drop in the Sharpe ratio was all but inevitable.
Does sliding the start date give a better answer?
To depend less on any single period, look at Holding-period outcomes in the Performance section. It slides an N-year window forward one month at a time and records the annualized return of each window, a calculation known as rolling returns. For a 1-year holding period, the windows run January–December 2015, February 2015–January 2016 and so on, 109 windows in all.
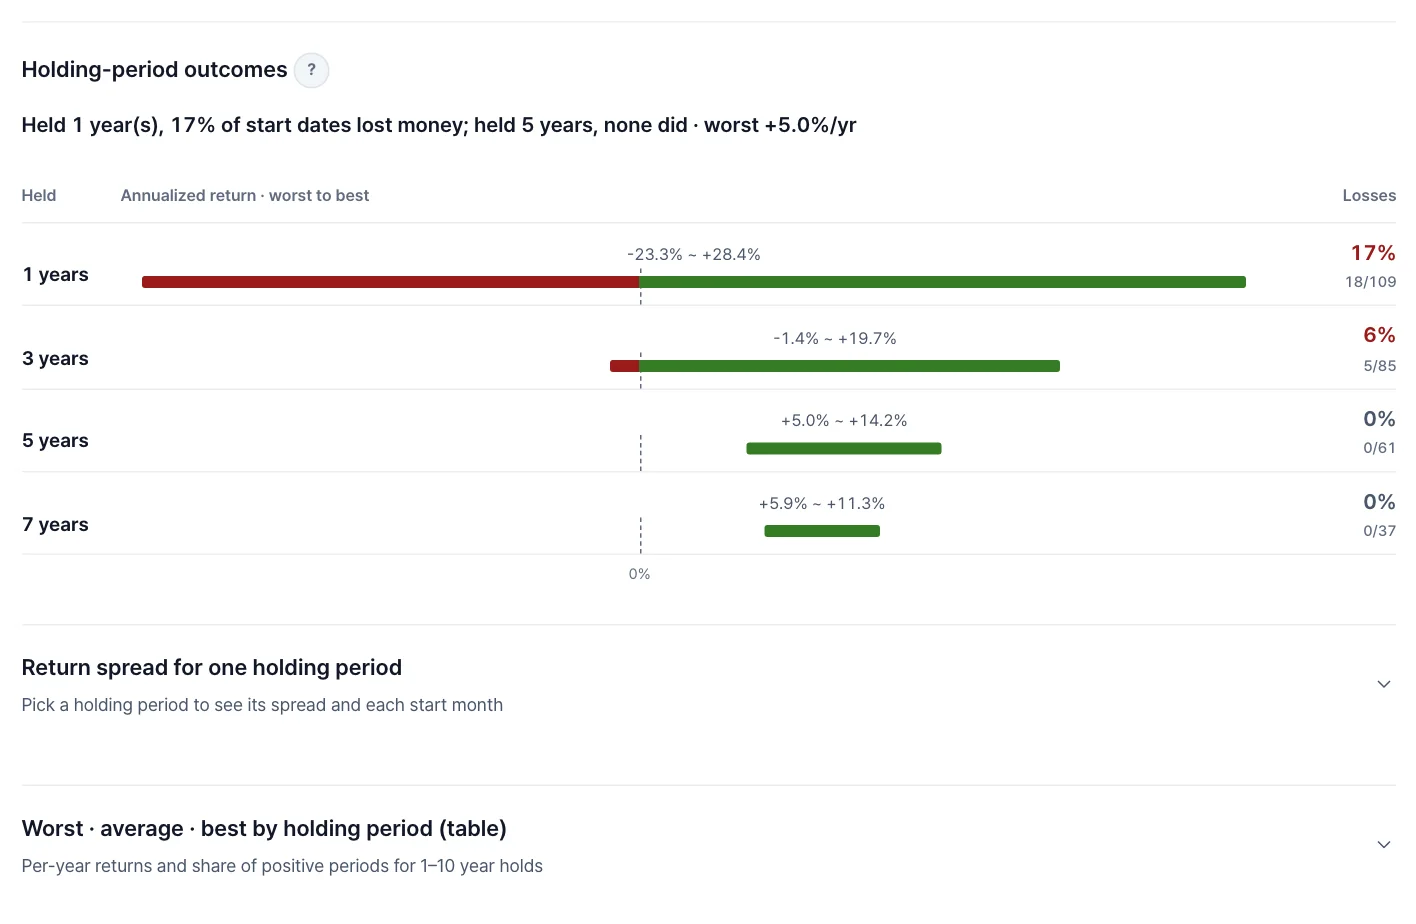
Each bar joins the worst and best windows for that holding period, and any part left of 0% is colored red. Expand "Worst · average · best by holding period (table)" underneath to get the numbers, averages included, or expand "Return spread for one holding period" for a bar chart of how the 1-year returns were spread out (in the example, the medians are +10.1% for the portfolio and +15.3% for SPY). The screen shows these to one decimal place.
| Holding period | Windows | Worst | Average | Best |
|---|---|---|---|---|
| 1 year | 109 | −23.31% | 8.49% | 28.40% |
| 3 years | 85 | −1.36% | 7.94% | 19.71% |
| 5 years | 61 | +5.01% | 9.07% | 14.19% |
| 7 years | 37 | +5.87% | 7.90% | 11.26% |
The best 7-year figure, 11.26%, is the same number this article opened with. January 2015 through December 2021 was the best of the 37 seven-year windows, and the worst returned 5.87% a year. Pick an end date by hand and you can land on the best or the worst window like this without meaning to.
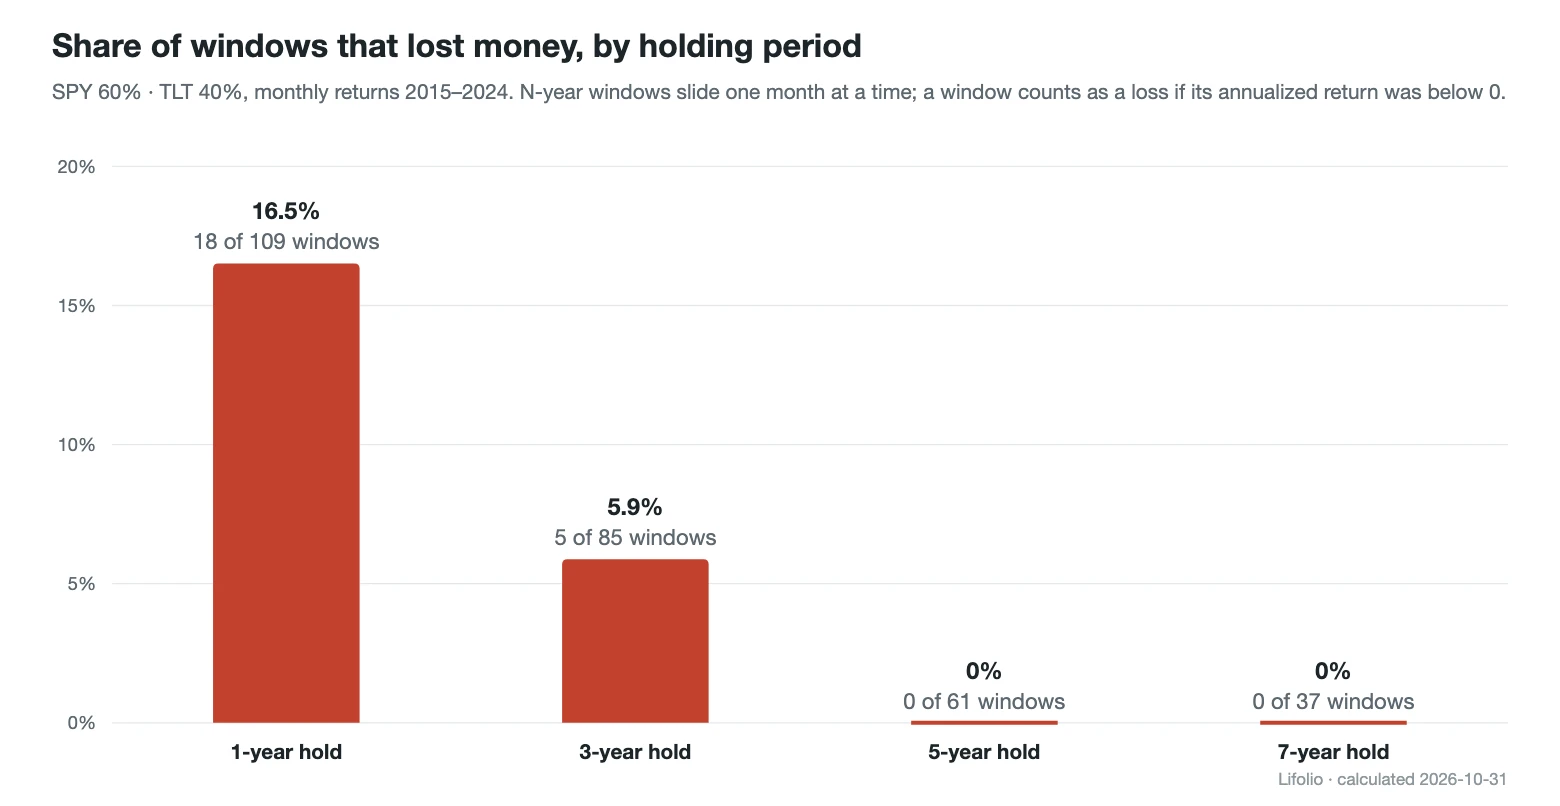
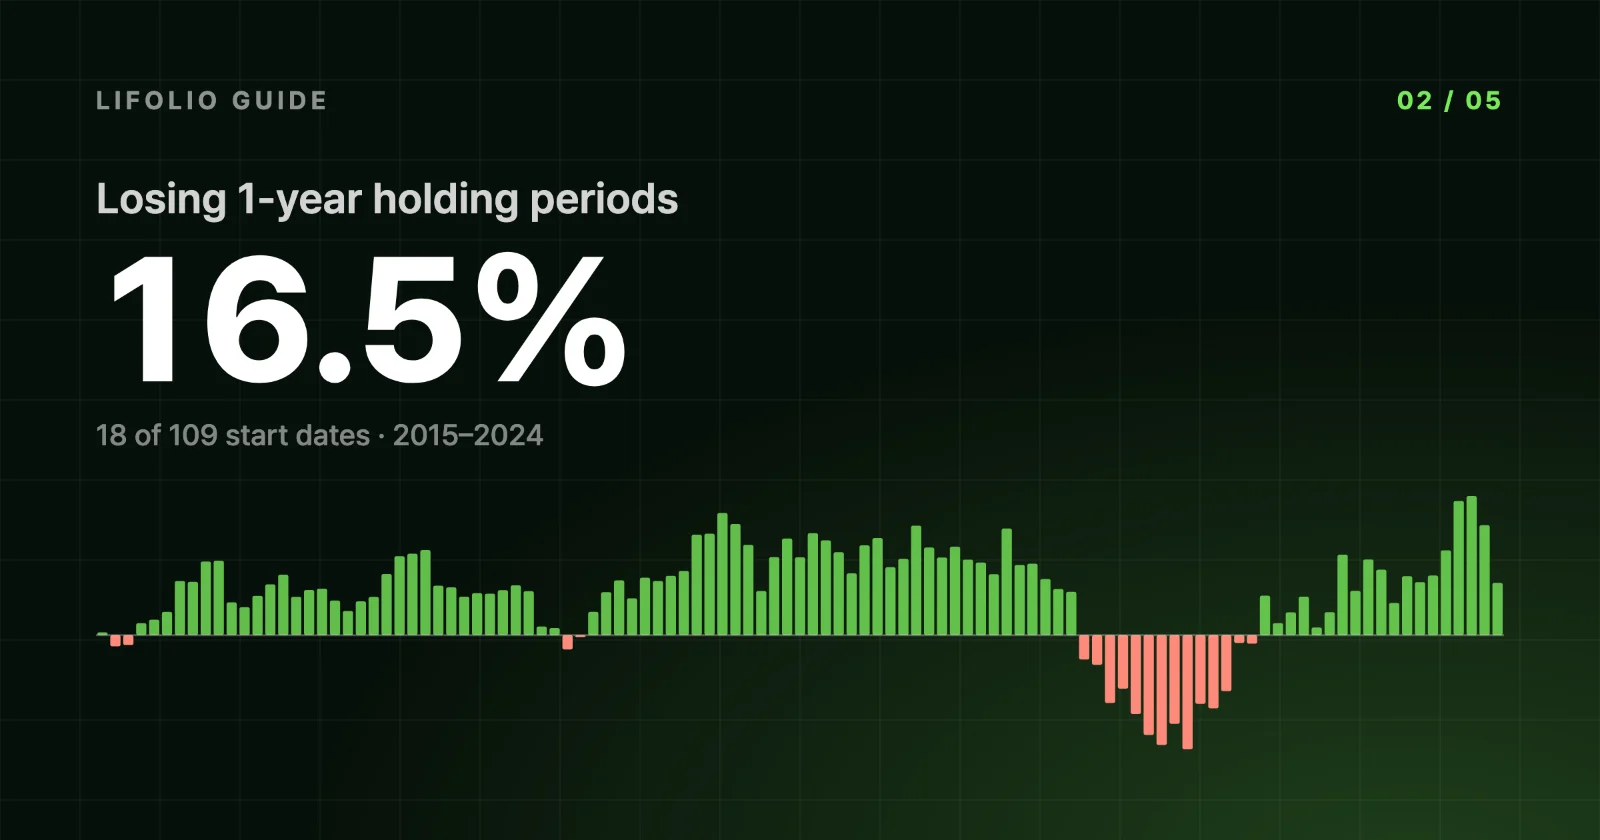
Held for just one year, the portfolio lost money 16.5% of the time (18 of 109 windows). The worst of those windows ran from January to December 2022, in other words calendar year 2022. The longer the holding period, the better the worst result, and from five years on there are no losing windows at all. The sentence at the top of Holding-period outcomes says the same thing, that no five-year holding period lost money no matter when you bought, and both that sentence and summary card ④ round the 1-year loss share to 17%.
Is the loss share a probability of future losses?
No. Two neighboring 1-year windows share 11 of their 12 months, so one big decline like 2022 turns window after window that overlaps it into a loss. In fact, 14 of the 18 losing windows include part of 2022. The result is closer to one event counted many times than to 109 independent trials.
The same goes for the 0% at five years. The 61 windows are overlapping slices of one stretch of history, 2015–2024. They show that no five-year stretch within these ten years lost money. They don't prove that holding for five years protects you from losses. The 10-year holding period has only one window (7.63% a year), so it hardly counts as a distribution. That is why the distribution chart carries a note saying these are historical holding-period results, not the probability of future returns. To see when the losing windows clustered, expand "Return spread for one holding period" and switch it to the Over time view, which lays them out in chronological order.
Don't bonds cushion the fall in a crisis?
Cumulative returns during crisis windows, in the Risk & recovery section, finds the predefined market crises that overlap your backtest period and calculates the cumulative return over each one from daily prices. This example covers three of them.
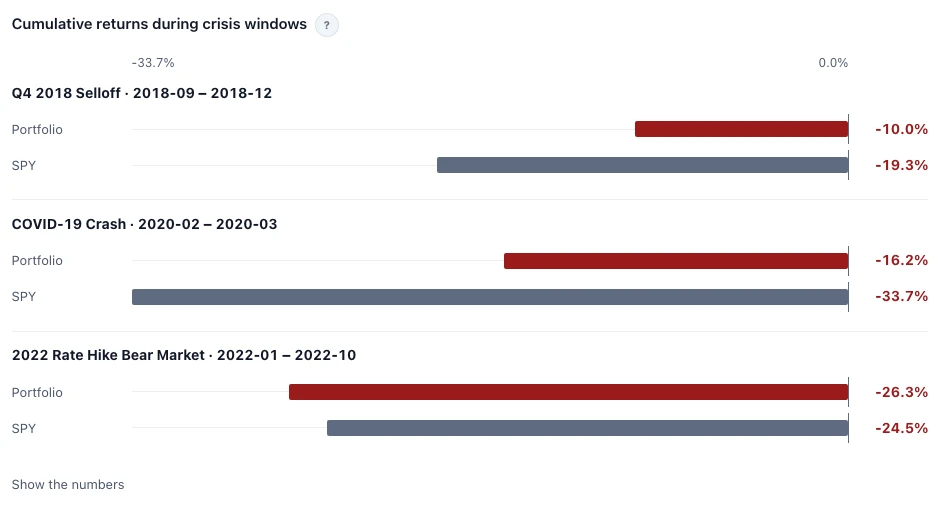
In the first two, the 40% in bonds did its job. In the fourth quarter of 2018, and again in spring 2020 when SPY lost more than a third of its value, the portfolio's decline was held to roughly half of SPY's. 2022 was different. As interest rates rose rapidly, long-term Treasuries fell along with stocks, and the 60/40 portfolio lost more than SPY both in the crisis window and for the full year. For 2022 as a whole, TLT returned −31.24%, SPY −18.17% and the portfolio −23.31%. The asset added as a cushion fell the most of the three.
The expectation that stocks and bonds move differently rests on how they behaved in the past, and even within these ten years it held twice and failed once. A backtest can't tell you whether the next crisis will look like 2020 or like 2022. The crisis list also includes the dot-com crash and the global financial crisis, but they don't appear in this result because the example starts in 2015.
What assumptions sit behind the numbers?
Beyond the period and the crises, every result rests on a few assumptions. Most are documented in Methodology, and they are where a backtest and a real account tend to part ways.
- Common data period: The backtest covers only the period for which every selected asset has price data. Add an ETF that launched later and the start date shifts to match it, with a warning, and the crisis windows discussed above may drop out entirely. This example's start date was entered as Jan 1, 2015, but because that was a market holiday, the calculation began on the first trading day, Jan 2.
- Trade timing and costs: Monthly rebalancing assumes trades execute immediately at the closing price on the last trading day of each month; bid-ask spreads and execution delays are not modeled. The backtest screen has no field for transaction costs, so trading commissions and taxes are not deducted, and a real account can come out lower by that amount.
- Dividends: With dividend reinvestment on, distributions are reinvested in the same asset. With it off, they accumulate as cash. If a dividend record is missing or arrives late, that part of the return may be missing from the result too.
- Price data: ETF prices come primarily from Yahoo Finance daily closing prices and dividend data, and confirmed gaps or errors are filled in from fund company disclosures or other data providers. Because this is third-party data, errors and later corrections are possible. How they are handled is described in Data Sources.
- Currency: The example is in US dollars. Choose KRW (Korean won) instead and the results pick up exchange-rate moves and use a different risk-free rate, so every number changes. The rules are in Why KRW returns differ from USD returns.
What should you check in your own results?
Before drawing a conclusion from any one result, check three more things on the same screen: how much the numbers move when you rerun with the end date a few years earlier, how low the worst result goes in Holding-period outcomes, and which crises Cumulative returns during crisis windows includes and which it leaves out. None of these will tell you future returns, but they show how much the numbers in front of you depend on the period you chose.
Frequently asked questions
Can I trust backtest results?
You can trust the arithmetic, because it can be checked. The numbers in this article were verified by entering the same settings again and confirming that the same values came out. But those numbers only tell you what would have happened "if you had held these assets over this period with these rules," and the execution assumptions and possible data errors described above still apply. No backtest can tell you future returns or the probability of a loss.
How many years of data do you need for a backtest?
This result doesn't point to a number of years that is enough. What it does show is that the shorter the window, the more widely the results were scattered. Returns over 1-year windows ranged from −23.31% to 28.40%, the worst 3-year window was still −1.36%, and losing windows disappeared only at five years and longer. On the other hand, 10 years of data contain only one 10-year window, so to compare several windows of a long holding period, you need a data history much longer than the period itself.
What is survivorship bias?
Survivorship bias is the distortion that comes from looking only at what has survived to the present. In a backtest, it creeps in because you pick the assets today. The list of assets you choose from in Lifolio is also current, so the assets in a result tend to be ones you know by name today and that are still around. The result doesn't show what became of other candidates you might have picked for the same purpose in 2015, so part of a good result may come from choosing with hindsight.
The numbers in this article were verified by rerunning the same settings on Nov 6, 2026. If you spot an error, please let us know using the Send Feedback button at the bottom right of the screen.