
Why KRW returns differ from USD returns
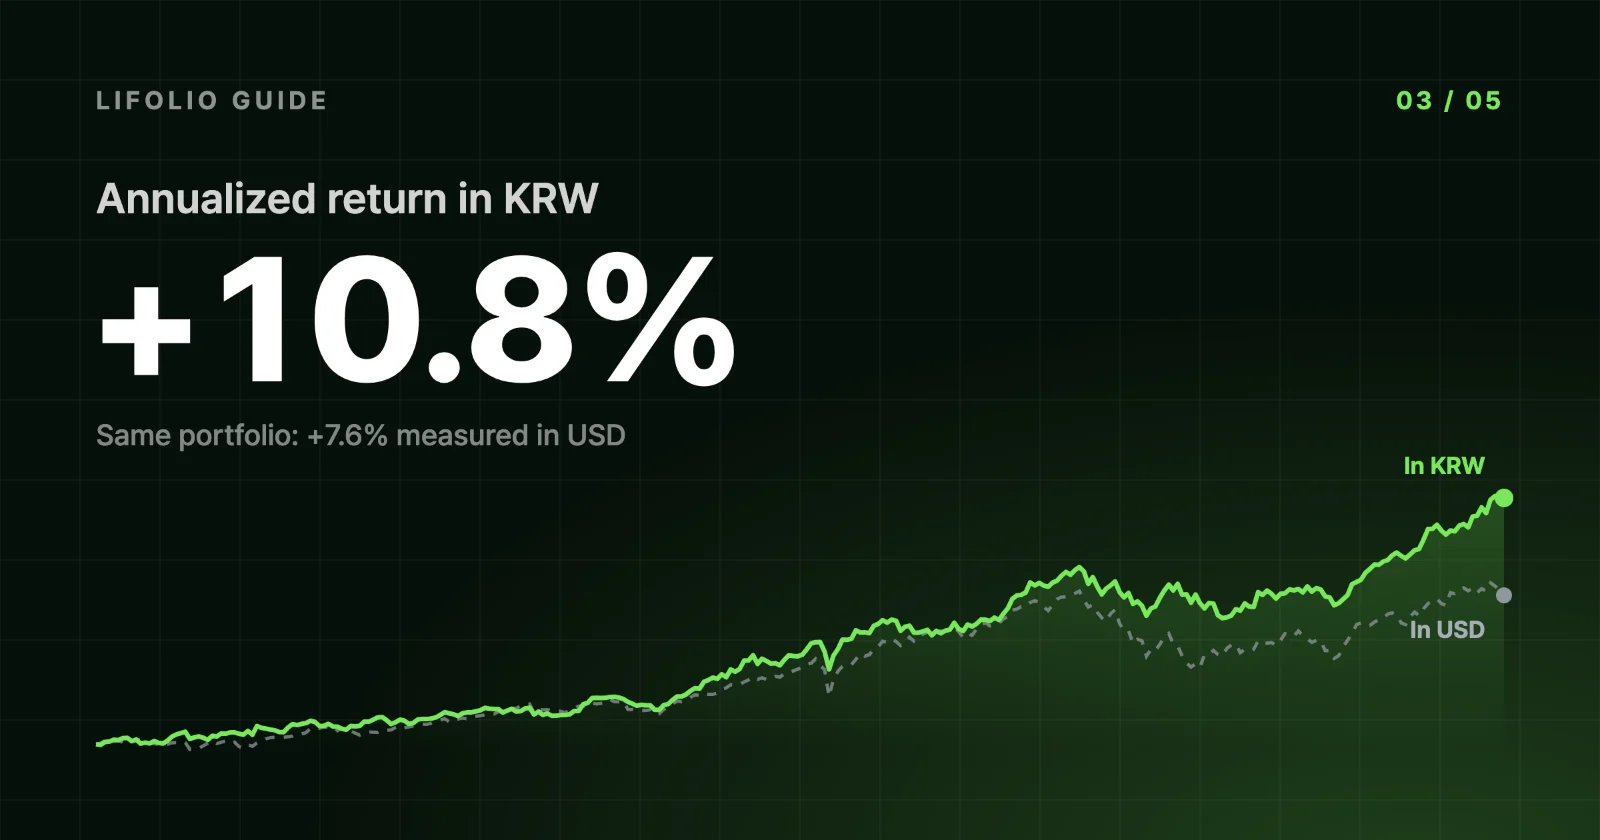
An SPY 60%/TLT 40% portfolio returned 7.6% a year in dollars but 10.8% in won. Actual 2015–2024 exchange rates show why returns and drawdowns diverged.
In this guide 6
Hold 60% SPY and 40% TLT for 10 years and, measured in US dollars, the result is an annualized return of +7.6% and a max drawdown of −27.6%. Change only the reporting currency to KRW in the settings and the same portfolio returns +10.8% a year with a max drawdown of −19.0%. The assets, the period and the rebalancing are all unchanged, yet the return is more than 3 percentage points higher and the worst decline more than 8 points shallower.
Neither result is wrong. The dollar result measures your portfolio in dollars. The won result measures the same portfolio in Korean won, converted each day at that day's exchange rate. Lifolio reports results in either US dollars or won, so the choice matters most to anyone who buys US ETFs with won. If you buy them with won and track them in won, the second number is closer to what your own account shows. It still won't match exactly, because the bank's exchange-rate spread and conversion fees are left out. The won result blends the assets' performance with exchange-rate movements, so below we use actual exchange rates to pull the two apart.
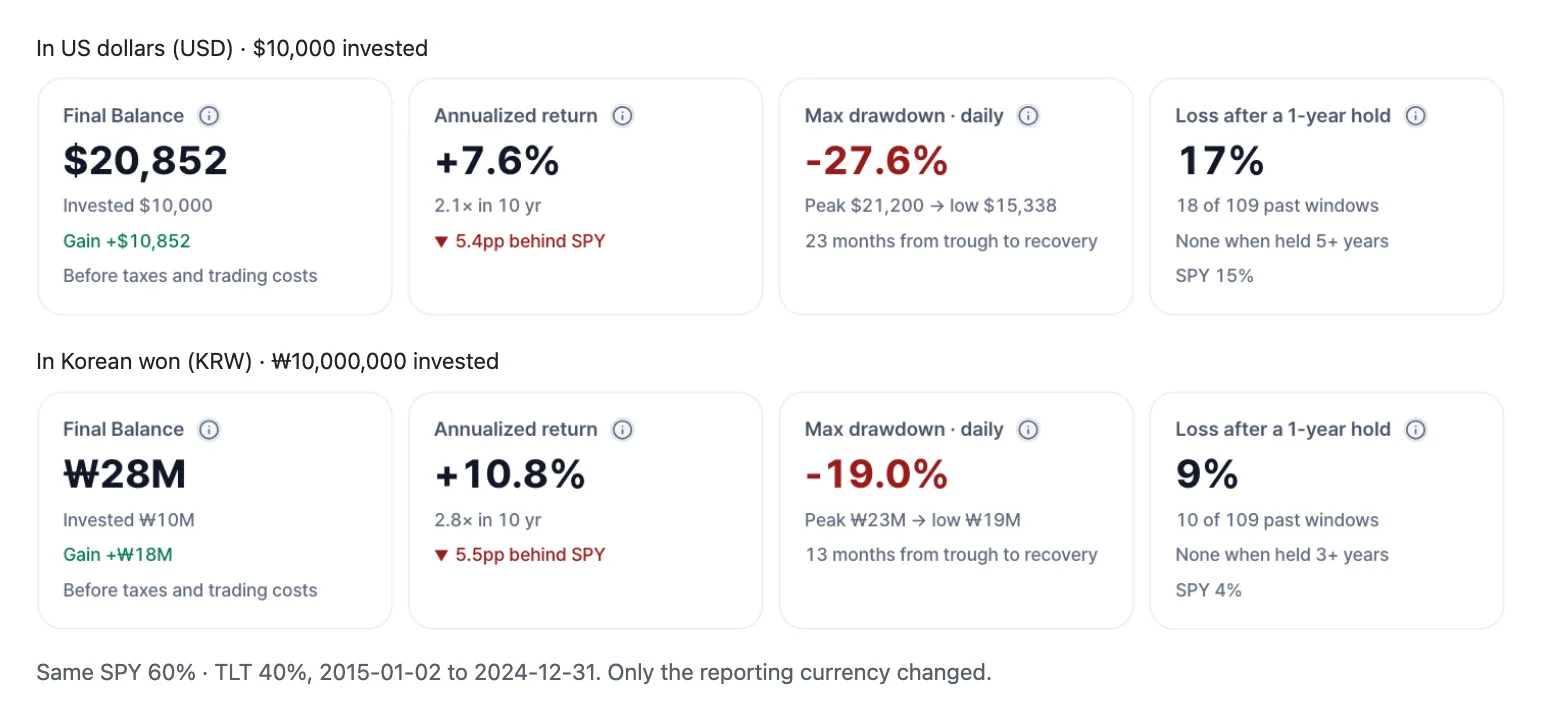
Open this example in KRW in Lifolio to reproduce the bottom row of cards, or open it in USD for the top row exactly as shown. The remaining settings are listed in How to read backtest results.
Because the initial investment was entered separately in each currency, the final balances can't be compared directly. Compare the growth multiples instead. $10,000 became $20,852, so the dollar result grew 2.09×. ₩10,000,000 became ₩27,940,000, so the won result grew 2.79×.
The dollar rose 34% against the won in 10 years
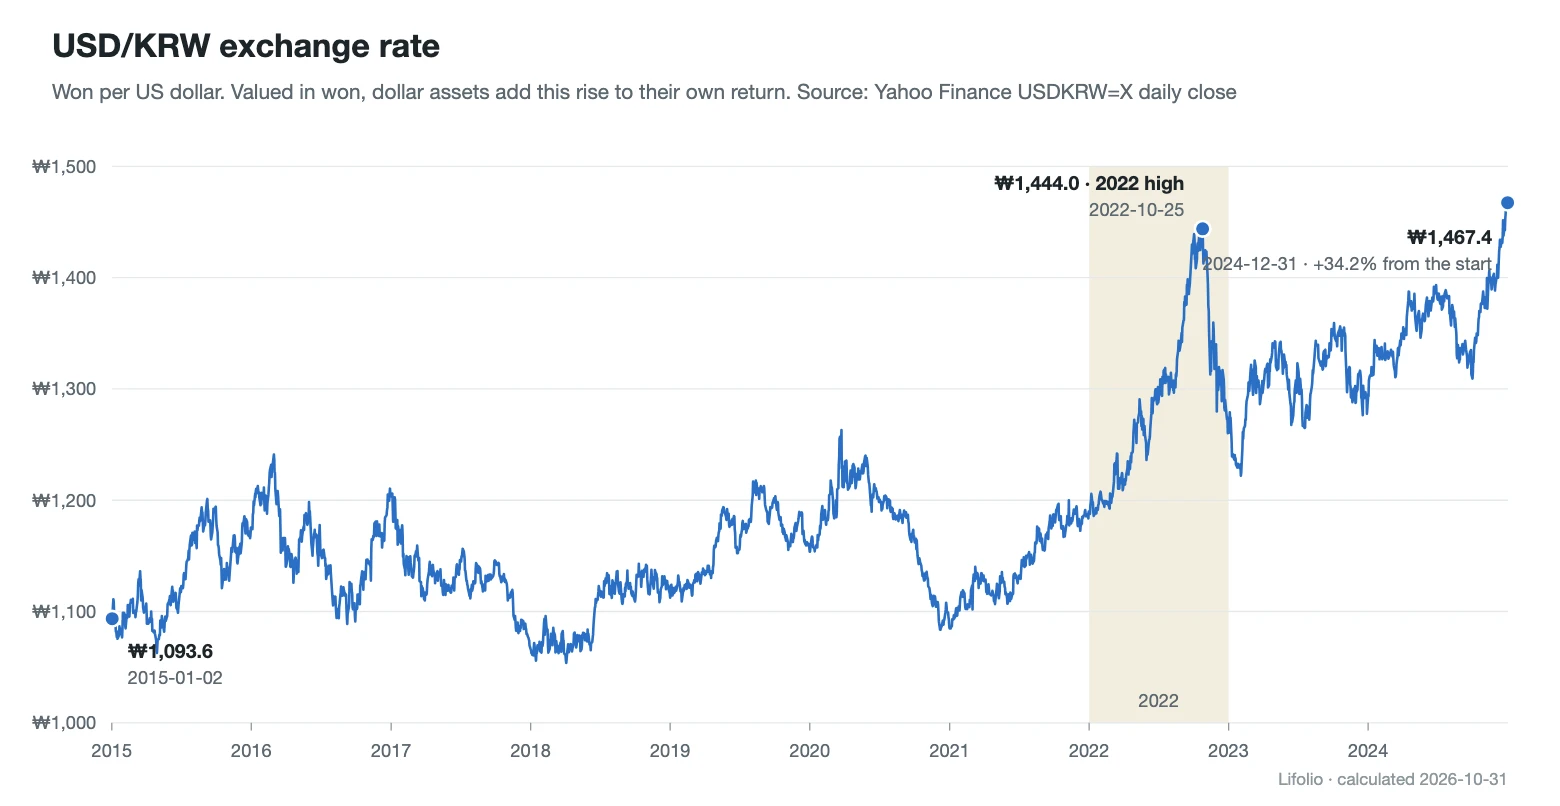
According to the exchange rates stored in Lifolio, one dollar bought ₩1,093.6 on Jan 2, 2015 and ₩1,467.4 on Dec 31, 2024. That is a 34.2% rise over 10 years, or about 2.98% a year at a steady pace. It didn't climb in a straight line: on Apr 4, 2018 it stood at ₩1,053.7, below where it started.
The portfolio's value in won is simply its value in dollars multiplied by that day's exchange rate, so the two results can be reconciled with a single multiplication.
- Growth multiple: 2.09× × 1.34× ≈ 2.8×. The calculation actually starts from the close just before the first trading day, Dec 31, 2014 (₩1,095.3). Redo the multiplication with that rate and you get 2.0852 × 1.3397 = 2.7936, exactly the ₩27.94 million on the won card.
- Annualized: (1 + 7.63%) × (1 + 2.98%) − 1 ≈ 10.8%, matching the +10.8% on the won card.
In other words, the won return was higher not because measuring in won is inherently favorable, but because the won weakened against the dollar over these 10 years. That currency gain added roughly 3 percentage points a year.
2022: −27.6% in dollars, −19.0% in won
Drawdowns are more complicated. Even the dates of the peak and the trough differ by currency.
| Measure | In USD | In KRW |
|---|---|---|
| Peak | 2021-12-27 | 2021-11-09 |
| Trough | 2022-10-20 | 2022-12-30 |
| Recovery | 2024-09-12 | 2024-01-29 |
| Max drawdown (daily) | −27.6% | −19.0% |
| Trough to recovery (card) | 23 months | 13 months |
In 2022, while stocks and long-term bonds fell together, the exchange rate moved sharply the other way. It was ₩1,185.9 on Dec 27, 2021, the peak in dollar terms, and ₩1,435.0 on Oct 20, 2022, the trough in dollar terms, a rise of 21%. Convert a portfolio that had shrunk 27.6% in dollars at a rate 21% higher, and in won it was only about 12% below its value on that same peak day. The stronger dollar absorbed more than half of the loss.
So why is the max drawdown in won −19.0% rather than −12%? Because the won series has its own peak and its own trough.
The won peak came a month and a half earlier. On Nov 9, 2021 the rate was ₩1,199.9, higher than at the end of December, so the portfolio's value in won was at its highest that day. The won trough came a little over two months later. After Oct 20 the portfolio started climbing again in dollars, but the exchange rate fell quickly from its October high and was down to ₩1,260.3 by Dec 30. The currency took away more than the dollar gains brought back, so the won value kept shrinking until year-end. Within a single decline, the exchange rate first softened the loss and then deepened it.
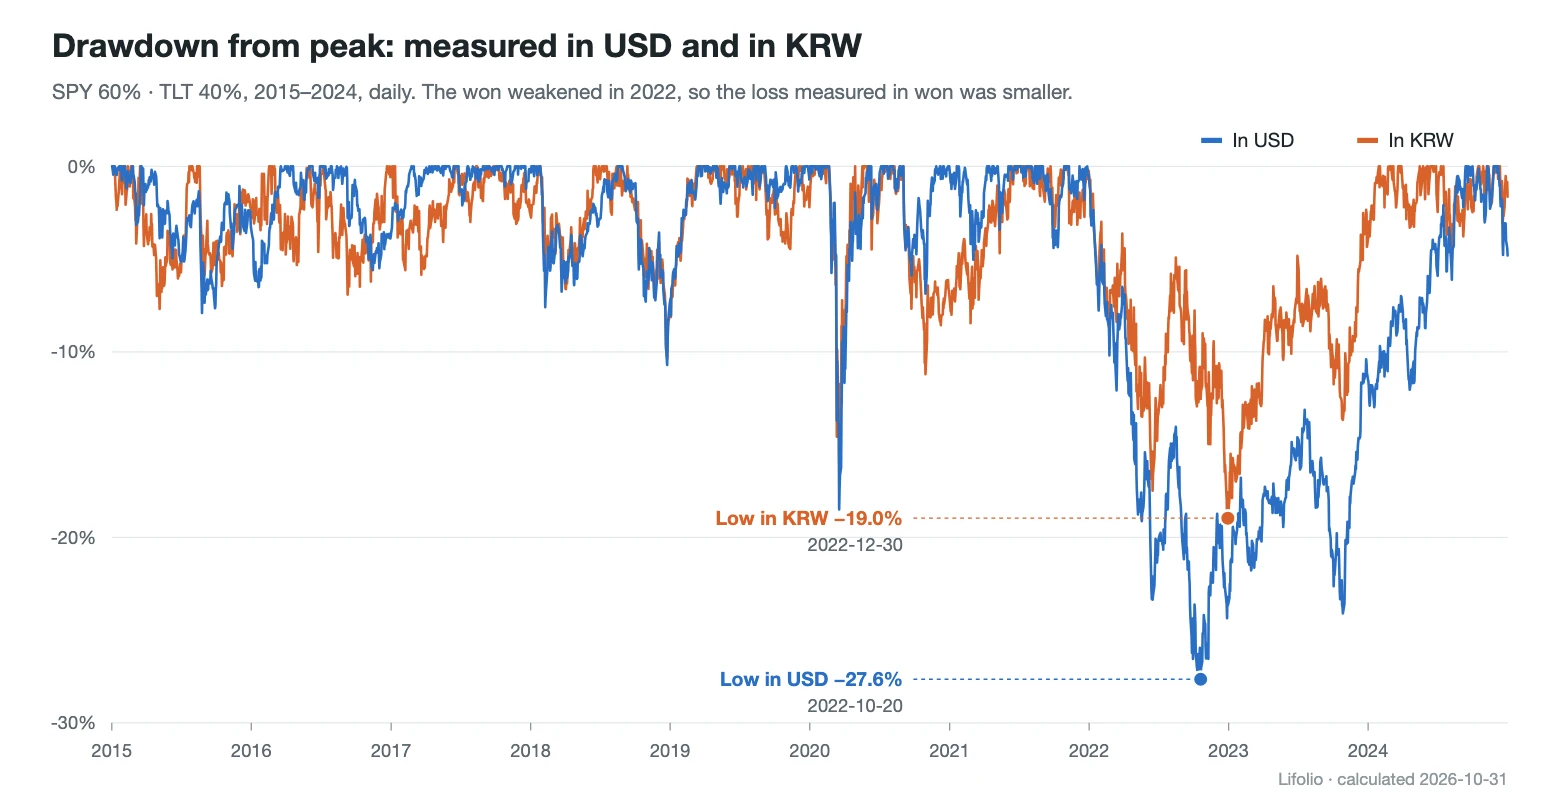
Recovery was faster in won. In won terms, the portfolio regained its peak on Jan 29, 2024, 13 months after the trough. In dollar terms it took 23 months, until Sep 12, 2024. The exchange rate on the won recovery day was about 6% higher than on the won trough day, which also helped bring the recovery forward. And because the won trough happened to fall on the last trading day of December, the month-end figure (−18.77%) is almost the same. The two bases, and how recovery time is counted, are covered in MDD on a daily vs month-end basis, and recovery time.
Summary card ④, Loss after a 1-year hold, splits as well. The 1-year windows that ended in a loss were 18 of 109 (17%) in dollars and 10 of 109 (9%) in won.
All of this is simply what happened in 2015–2024. There is no rule that the dollar strengthens every time stocks fall, and if the won strengthens during a decline, the drawdown in won can end up deeper. November–December 2022 briefly showed that pattern.
The gap to the benchmark barely moves
Even with returns and drawdowns shifting this much, the annualized gap to the benchmark is nearly the same: −5.4 percentage points in USD and −5.5 in KRW. The SPY benchmark is converted on the same days at the same rates, so the portfolio and SPY are both multiplied by the same exchange-rate factor. The gap neither disappears nor flips. It only widens slightly by that factor. Multiply the dollar gap of −5.38 points by 1.0298 and you get about −5.54 points, the −5.5pp shown on screen.
When the portfolio and the benchmark are both dollar assets, switching currency leaves "how far did it trail SPY?" almost unchanged. What moves a lot is the absolute level of returns, drawdowns and recovery time.
Don't compare Sharpe ratios across currencies
The Sharpe ratio rose too, from 0.55 to 0.83. That doesn't mean the portfolio was more efficient in won. Switching currency changes all three inputs to the Sharpe ratio at once: return, volatility and the risk-free rate. The return picks up the currency effect, volatility, which now includes exchange-rate swings, goes from 11.35% to 10.78%, and the rate being subtracted becomes another country's rate altogether. The formula is in the Sharpe ratio entry.
- In USD: the US 3-month Treasury bill rate, TB3MS from FRED
- In KRW: the 91-day CD rate, CD91 from the Bank of Korea's ECOS
CD91 is a stand-in for a short-term won rate. It is not the return you would actually earn by holding a risk-free asset. For both rates, each month uses the previous month's reading. That is also why Lifolio advises comparing Sharpe ratios only under the same settings. Compare within a single currency: in dollars it is the portfolio's 0.55 against SPY's 0.76, and in won 0.83 against 1.01. Either way, this portfolio's Sharpe ratio was lower than SPY's.
How Lifolio converts results to won
When you choose KRW as the reporting currency, the settings screen shows the note "Inputs, returns, and risk metrics are all calculated in KRW using historical exchange rates." The rules work like this.
- Exchange rates are daily closes from Yahoo Finance's USDKRW=X. The prices and dividends of dollar assets, and the SPY benchmark, are all converted at that day's rate, so investing in won works the same as buying the dollar assets at that day's rate.
- On days with no exchange rate, such as weekends or foreign-exchange market holidays, the most recent confirmed rate is carried forward, for up to 7 calendar days.
- If the rate is missing for more than 7 days, the gap is not filled with a fixed rate or a future rate. Instead, the analysis period is shortened to the stretch with continuous rates, or the calculation stops.
- Exchange-rate data begins on Dec 1, 2003, so a KRW backtest can't start earlier than that.
The data sources are listed in Data Sources, and the order of calculation in Methodology.
Frequently asked questions
I invest in won. Which result should I look at?
If you convert won to buy US ETFs and track them in won, the won result is closer to what you'll see in your account. The dollar result shows what the assets themselves earned, and the difference between the two is what the exchange rate added or took away. When comparing with other sources that report in dollars, use the dollar result so you're comparing like with like.
Does a rising dollar always mean a higher return in won?
No. The won return depends not on whether the rate rose along the way but on the rates at the start and end dates. Move this example's end date to Apr 4, 2018, when the rate hit its low for the period, and the exchange-rate factor is 1,053.7 ÷ 1,095.3 (the starting rate), about 0.96×. By the conversion formula, the won growth multiple then shrinks to 0.96 times the dollar multiple. Drawdowns, on the other hand, follow the path in between: while the rate falls quickly, as it did in November–December 2022, the won value can keep shrinking even as the dollar value recovers. You can change the end date in Backtest.
Are currency conversion fees included?
No. The exchange rate is the raw USDKRW=X daily close, and neither the spread between it and the rates banks quote nor conversion fees are included. The won result is not the amount you would actually have received after converting to won. It is the value of the dollar assets at each day's closing exchange rate. In a real account, where every conversion has a cost, the result will be lower than the on-screen number by that amount.
The numbers in this article were verified by rerunning the same settings on Nov 6, 2026. If you spot an error, please let us know using the Send Feedback button at the bottom right of the screen.