

Backtest guides
How to read backtest results, why results change with the period, KRW vs USD returns, daily vs month-end MDD, and what metrics such as CAGR and Sharpe mean.
Every example number in these guides was calculated in Lifolio, and each guide states the date of the screen it used. The calculation method and data are published in the two documents below.
Start here
New to backtest results? Read them in this order.
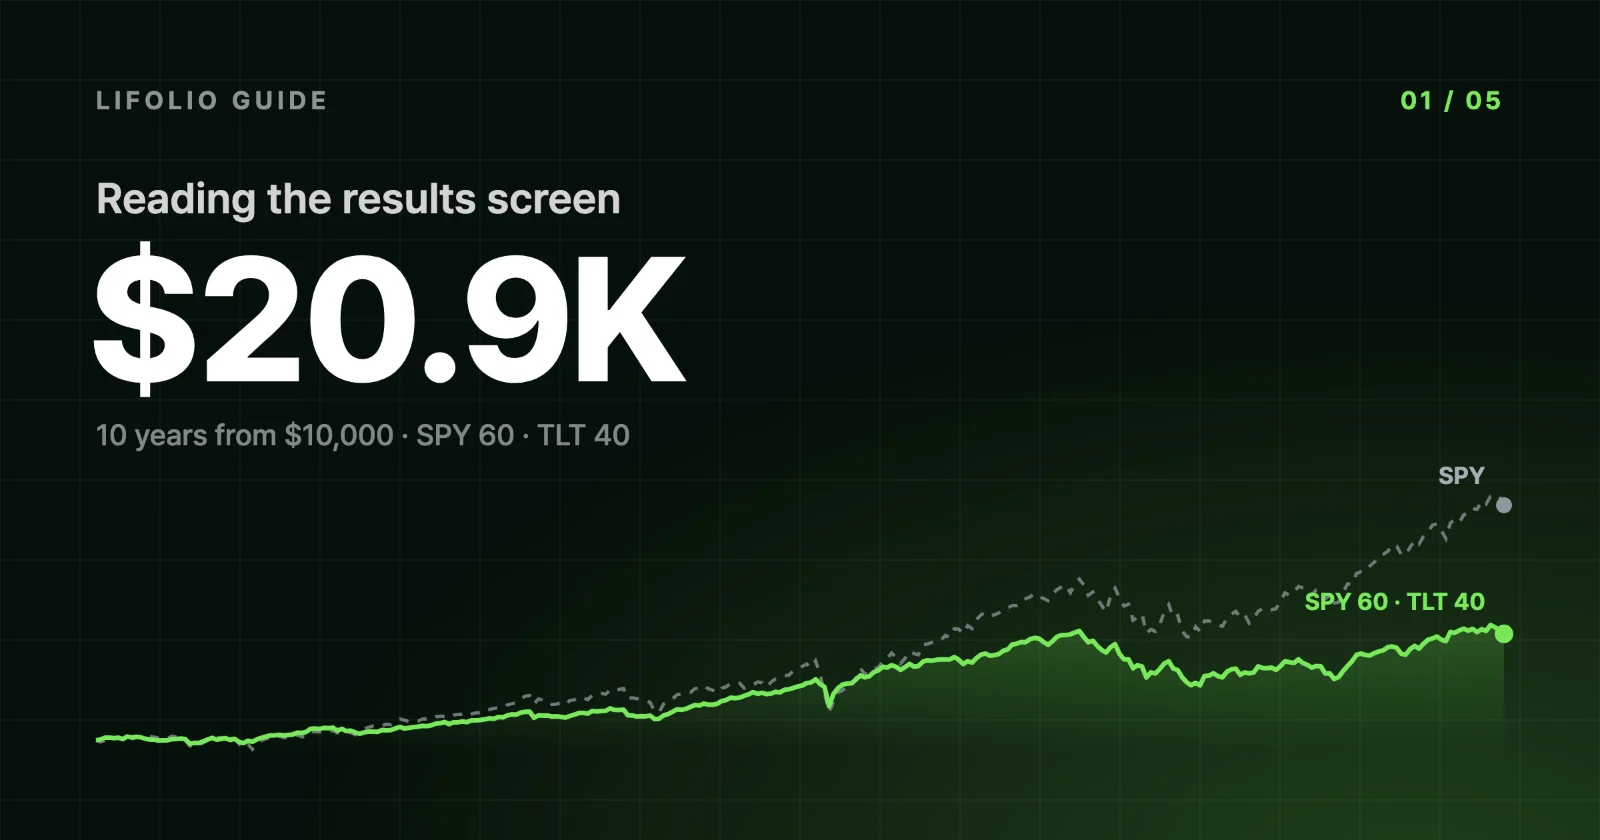
How to read backtest results: the four summary cards and the charts
Read the Final Balance, CAGR, max drawdown and Loss after a 1-year hold cards and the charts below them, using a 10-year SPY/TLT backtest as the example. 10 min read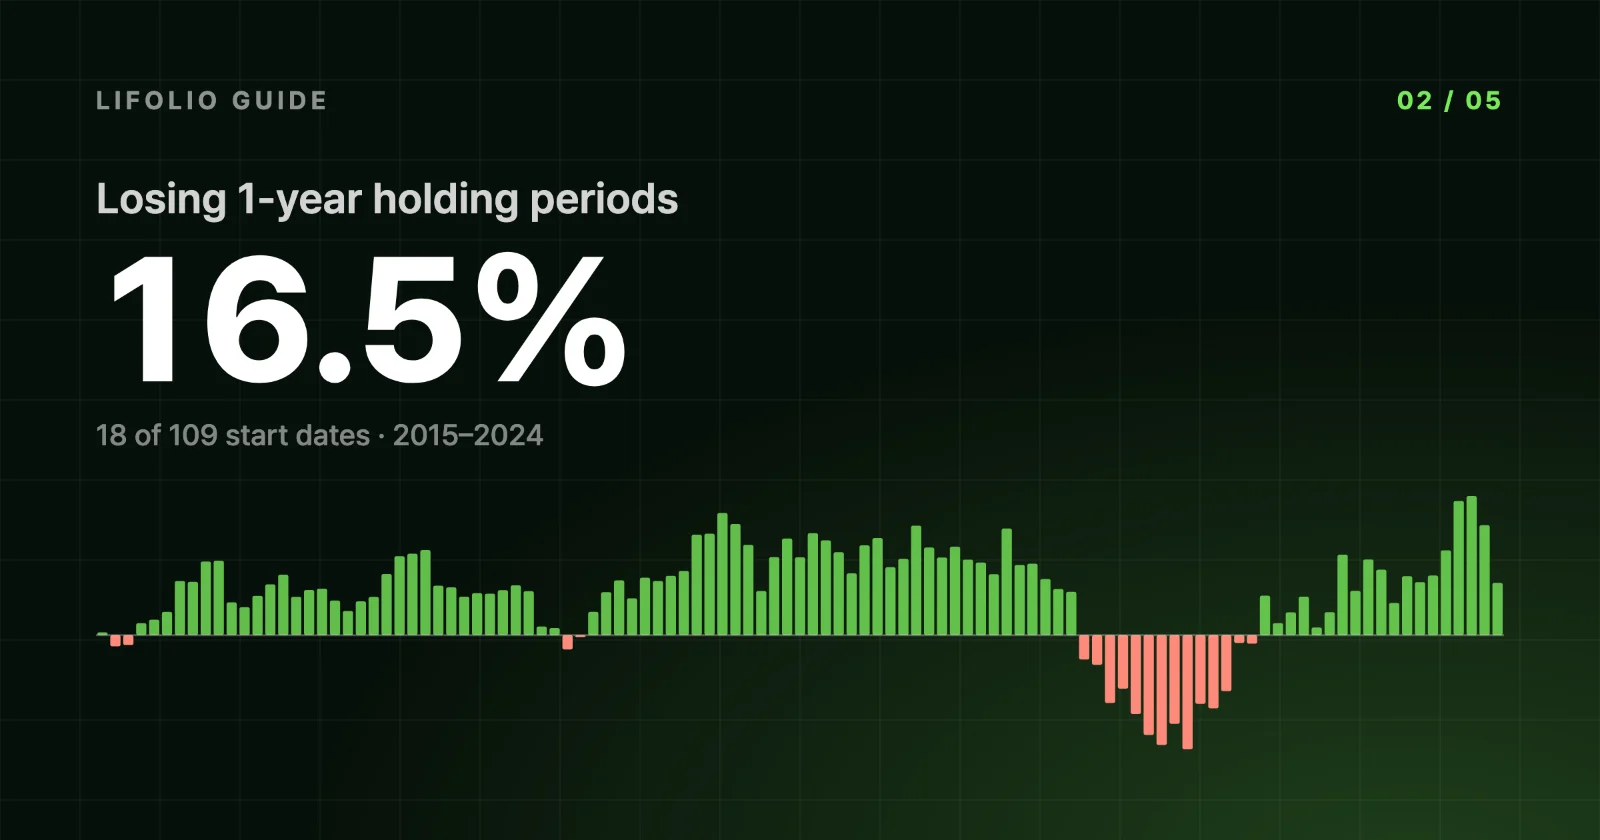
The limits of backtesting: why the date range you pick changes the result
Ending three years later cut an SPY/TLT portfolio's annualized return from 11.26% to 7.63%. See how the date range, holding period and crises shift backtests. 9 min read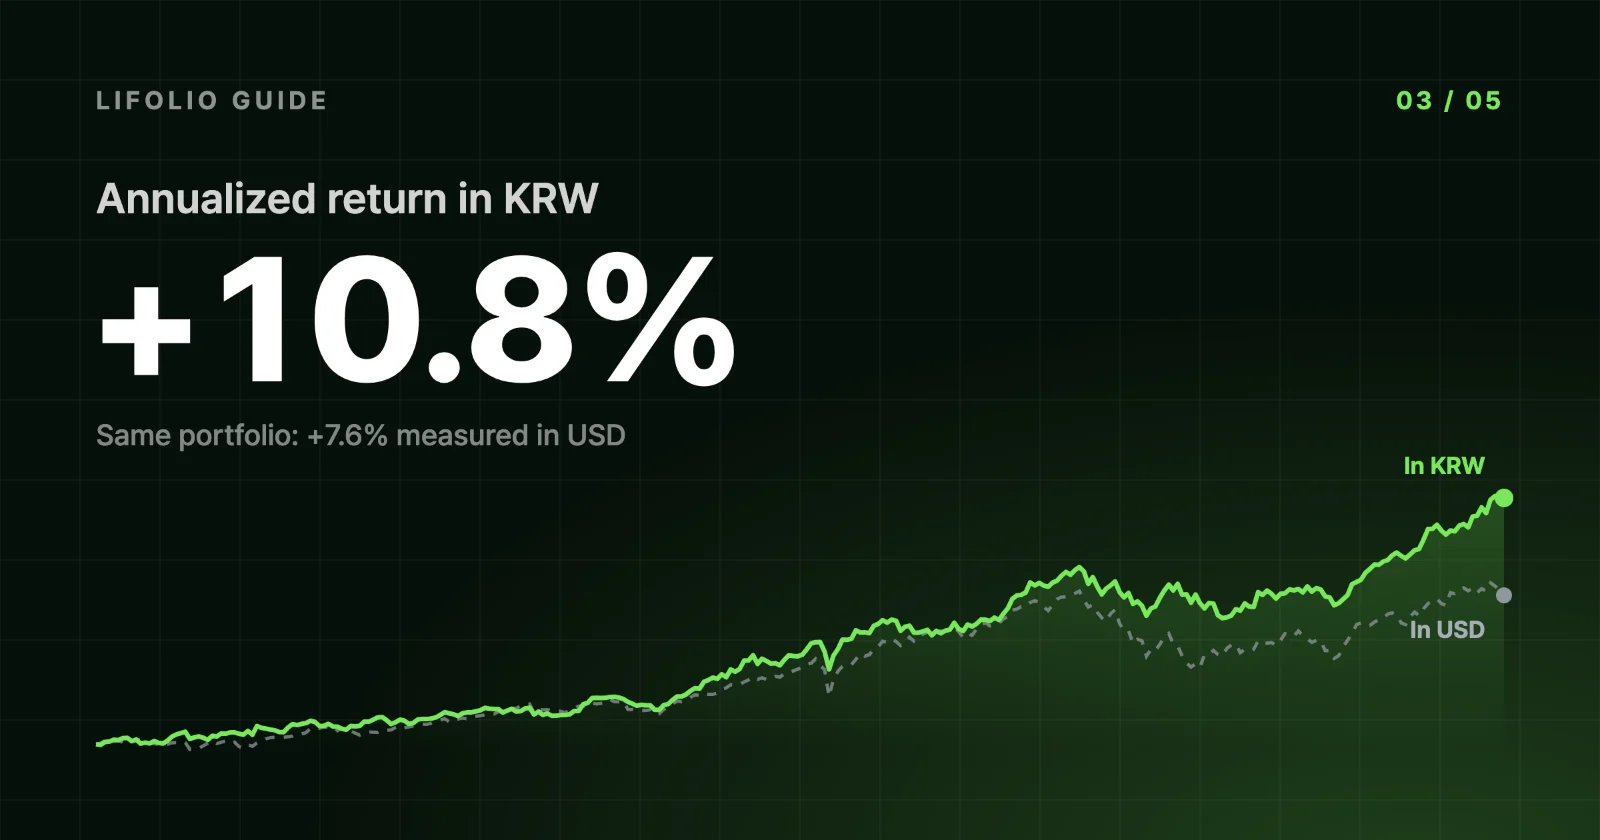
Why KRW returns differ from USD returns
An SPY 60%/TLT 40% portfolio returned 7.6% a year in dollars but 10.8% in won. Actual 2015–2024 exchange rates show why returns and drawdowns diverged. 9 min read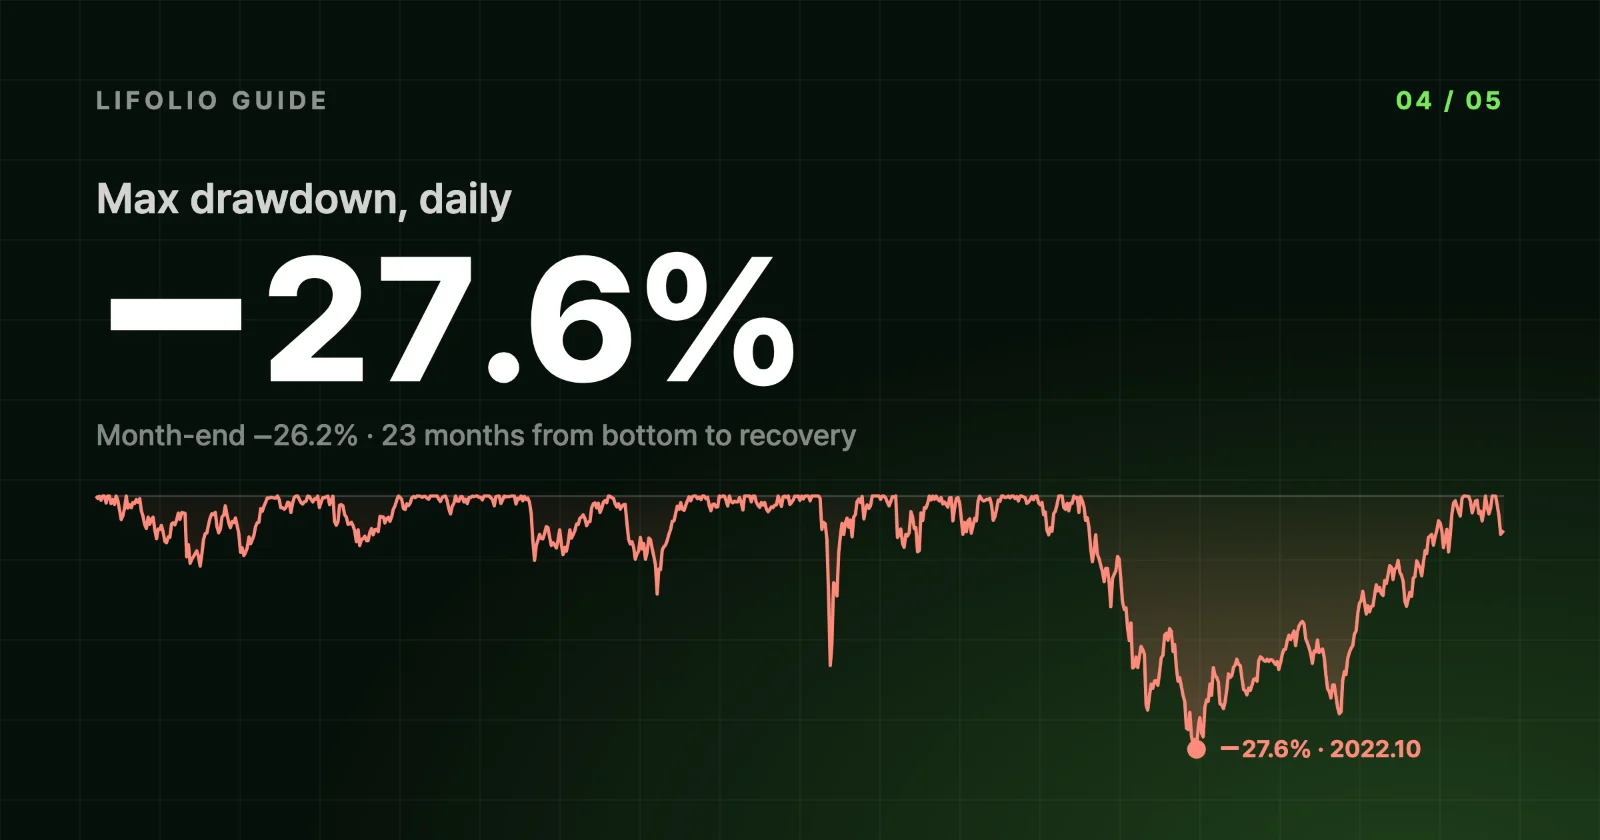
Maximum drawdown (MDD) explained: daily vs month-end MDD and recovery time
MDD is the largest drop from a peak. Real numbers show why daily and month-end MDD differ for the same portfolio, and what 23 months and 990 days each measure. 8 min read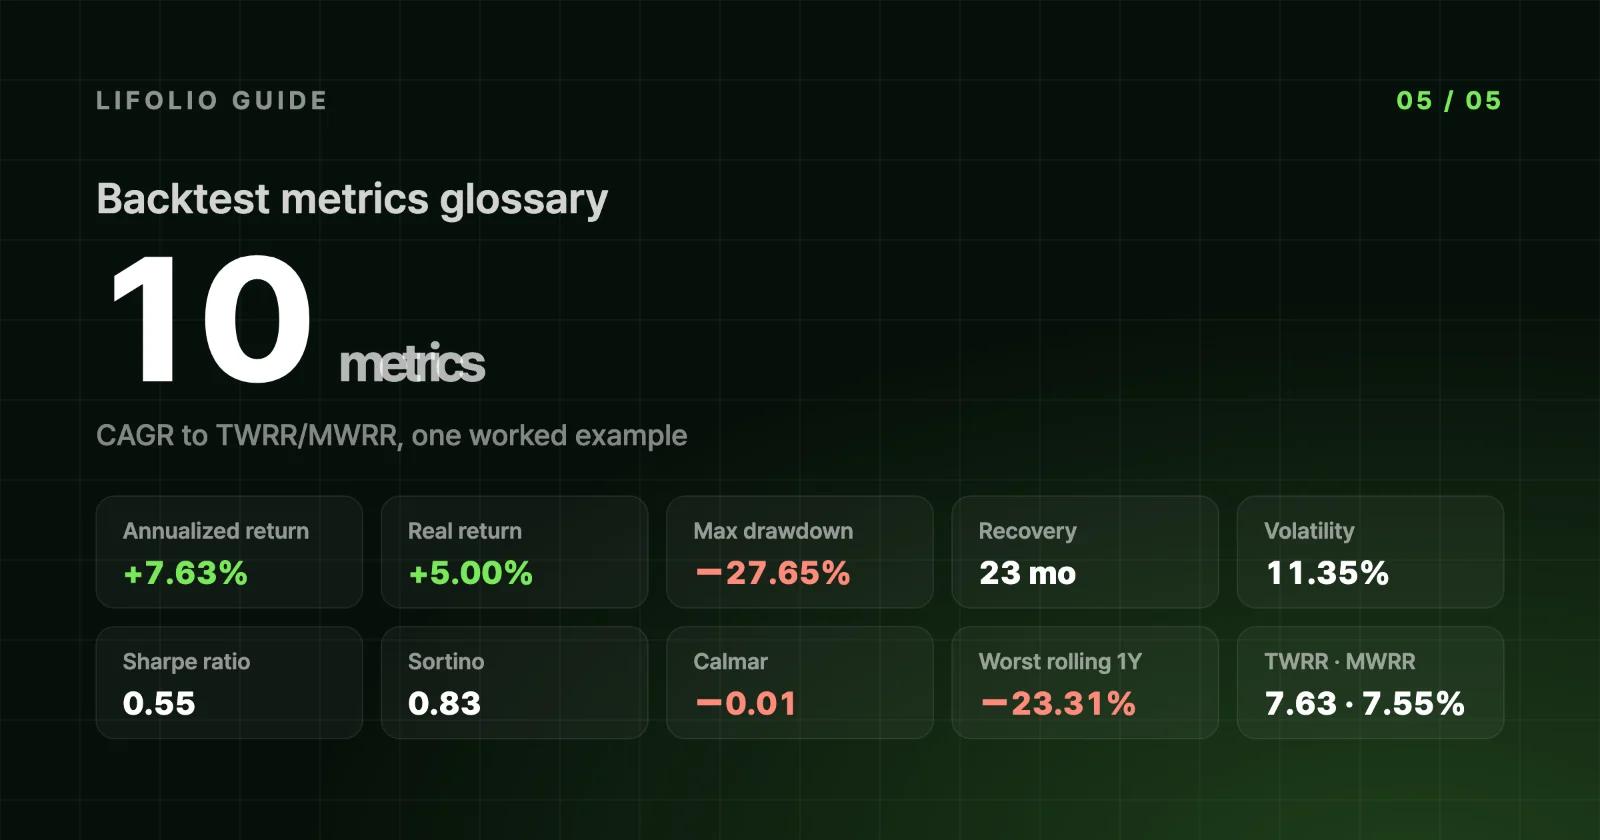
Backtest metrics glossary: CAGR, MDD, Sharpe and Calmar ratios explained
What CAGR, real return, MDD, volatility, Sharpe, Sortino, Calmar and TWRR/MWRR measure, with example values, how Lifolio calculates them and common pitfalls. 12 min read
Glossary