
How to read backtest results: the four summary cards and the charts
Read the Final Balance, CAGR, max drawdown and Loss after a 1-year hold cards and the charts below them, using a 10-year SPY/TLT backtest as the example.
In this guide 7
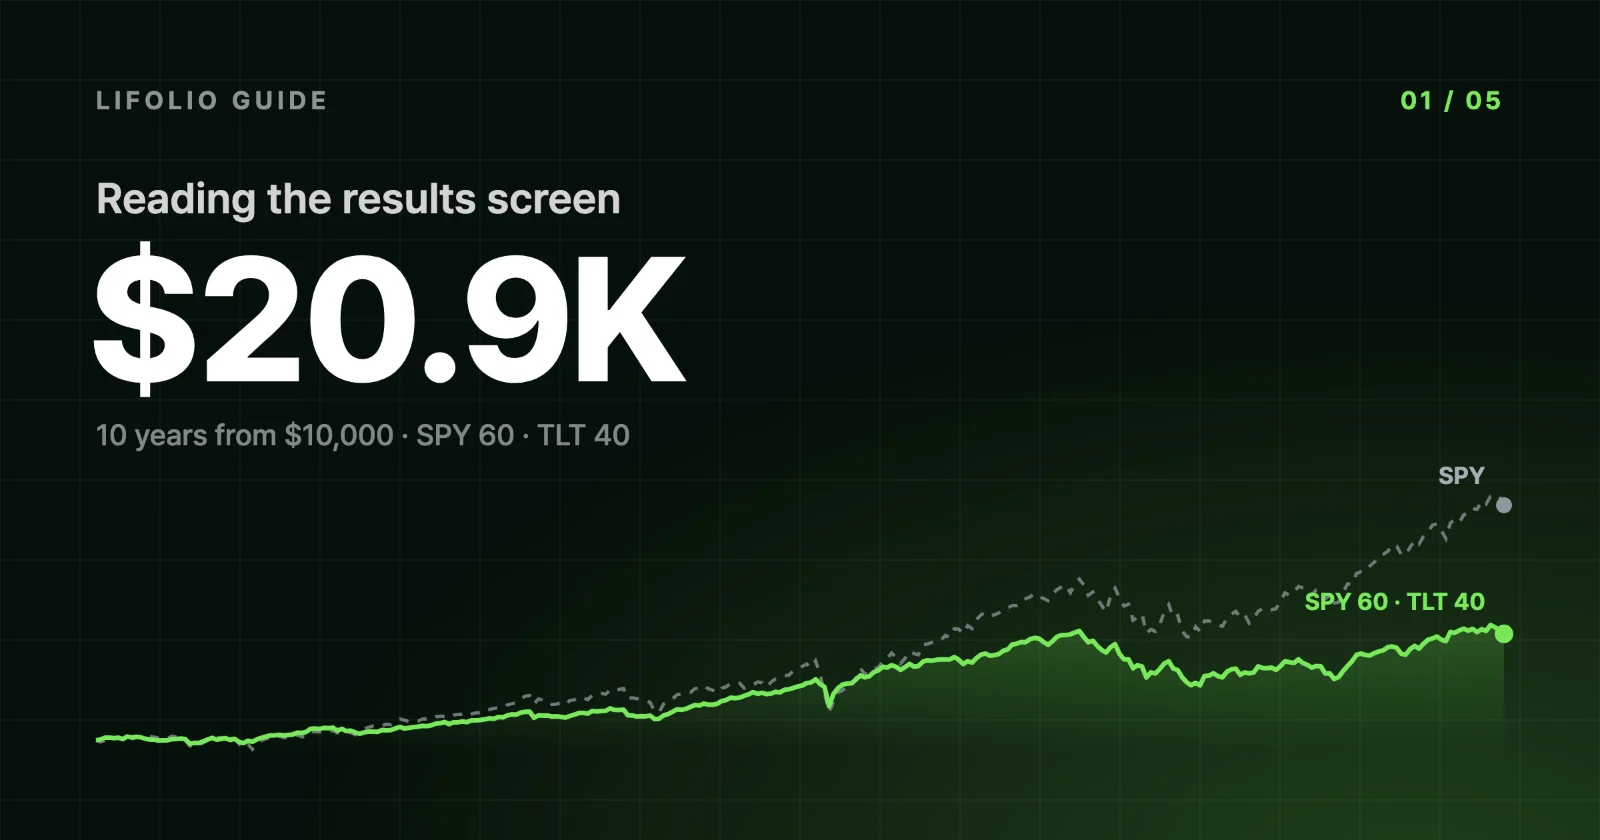
Run a backtest and four summary cards appear at the top of the results screen. For a portfolio split 60/40 between SPY and TLT over 10 years, they read $20,852, +7.6%, −27.6% and 17%. In plain terms: the starting $10,000 a little more than doubled, that growth works out to 7.6% a year compounded, at one point the portfolio was down more than a quarter from its peak, and if you had bought in any month and held for just one year, you would have ended with a loss about one time in six.
What none of the four numbers tells you is whether the portfolio actually held up better than SPY alone in down markets, or whether the bonds cushioned every fall. Those answers are in the charts and annual return bars below the cards, so we'll start at the top and work down.

What the four cards tell you, and what they hide
Click the info icon next to a card's name for a short note on how it is calculated.
① Final Balance $20,852
This is the portfolio's value on the last day of the period. The line below it, Invested $10,000, is the total amount you put in (including any contributions you set up), and Gain +$10,852 is the difference, with no taxes or trading costs deducted.
This card shows only where you ended up, not how you got there. In the example, the balance at the end of 2021 was already higher than on the final day. It fell sharply in 2022, climbed past its previous high in September 2024, then slipped back by year-end, so the period finished roughly where it had been three years earlier.
② Annualized return +7.6%
For $10,000 to grow to $20,852 in 10 years, it has to compound at about 7.6% a year. That single yearly compound rate for the whole period is the annualized return, also called CAGR (compound annual growth rate), and it excludes the effect of contributions and withdrawals. In the line underneath, "2.1× in 10 yr" expresses the same growth as a multiple, and "5.4pp behind SPY" means the portfolio's annualized return trailed SPY's by 5.4 percentage points (pp) over the same period.
What an average hides is how uneven the individual years were. The annual return bars further down show just how wide that range was. For the definition and formula, see Annualized return.
③ Max drawdown · daily −27.6%
This is the deepest decline from a previous high, measured using the portfolio's value on every trading day. The figure based only on month-end balances, −26.21%, appears separately in the All metrics window. The line below, "Peak $21,200 → low $15,338", gives the same decline in dollars. The line under that, 23 months from trough to recovery, is counted from the trough, so it measures a different span from the 990 days the portfolio spent below its high, which are counted from the peak. Why the two bases differ, along with the dates of the whole decline, is covered in MDD on a daily vs month-end basis, and recovery time.
④ Loss after a 1-year hold 17%
Take every 12-month window in the period, sliding forward one month at a time, and this is the share of them that ended in a loss. In the example, 18 of the 109 one-year windows (16.5%) lost money, which the card rounds to 17%. "None when held 5+ years" means that no window of five years or longer ended in a loss, and "SPY 15%" is the same share for SPY, counted the same way.
This share is a record of overlapping slices of a single history, the past 10 years, not a probability of future losses. The limits of backtesting explains why. The Sharpe ratio, which measures risk-adjusted return (0.55, SPY 0.76), is still available: expand "Metric comparison & market regimes" in the vs SPY section further down, or open the All metrics window. For the calculation, see Sharpe ratio.
Example settings
The cards above and the charts below all come from a single run with these settings.
| Setting | Value |
|---|---|
| Allocation | SPY 60% · TLT 40% |
| Period | 2015-01-02 to 2024-12-31 |
| Initial investment · contributions | $10,000 · none |
| Rebalancing · dividends | Monthly · reinvested |
| Benchmark · transaction cost | SPY · 0 |
| Reporting currency | USD |
Run it in Korean won with ₩10,000,000 instead and every number changes. Why KRW returns differ from USD returns explains why.
The growth chart: look at how wide the dips are, not just how deep
Below the cards, the results run down a single page in this order: Performance, Risk & recovery, vs SPY, Assets & diversification, Scenarios, and Data & export. Click a name in the section list at the top to jump straight to that section. The first chart in Performance, the top section, is the growth chart. Drawdown dates and crisis periods are in the next section down, Risk & recovery.
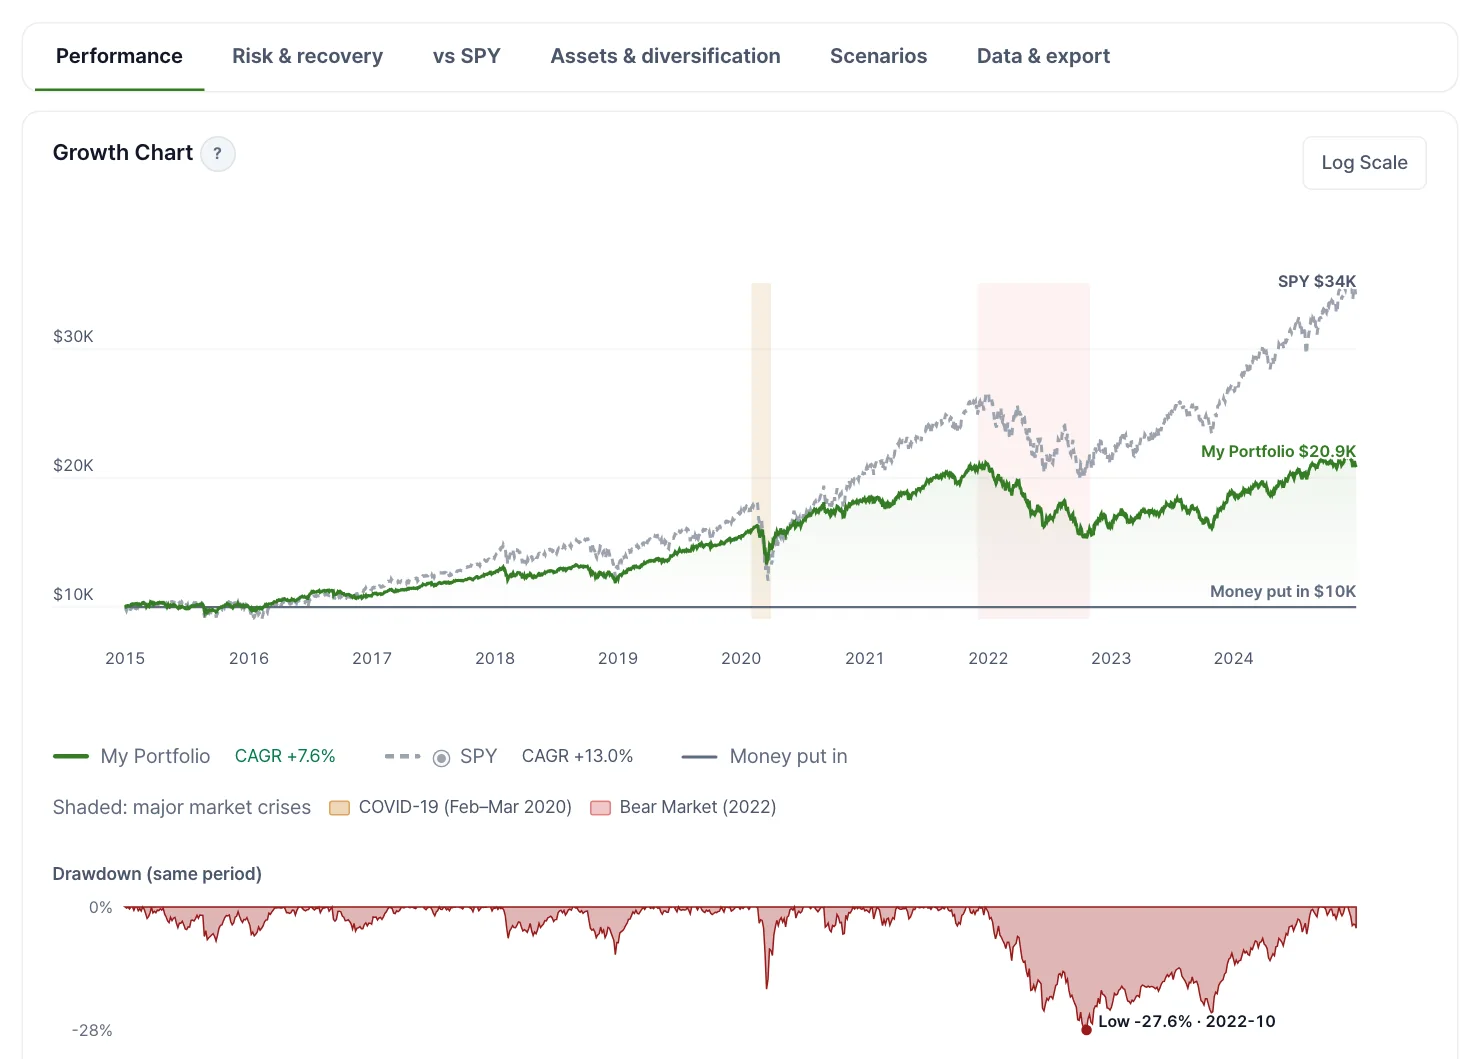
The solid green line is this portfolio, the dashed gray line is SPY, and the shaded bands are labeled COVID-19 (Feb–Mar 2020) and Bear Market (2022). In the 2020 band, the green line dips far less than the gray one and is back to its earlier level by early June. In the 2022 band, the two lines fall together, and the green line doesn't regain its earlier level until September 2024.
The Drawdown (same period) chart underneath plots how far below its previous high the portfolio was on each day. The deepest point is −27.6% in October 2022, matching card ③. The more telling detail is the width of each trough: the 2020 one is narrow and sharp, while the one that began at the end of 2021 stretches all the way to September 2024.
Annual returns: year by year against SPY
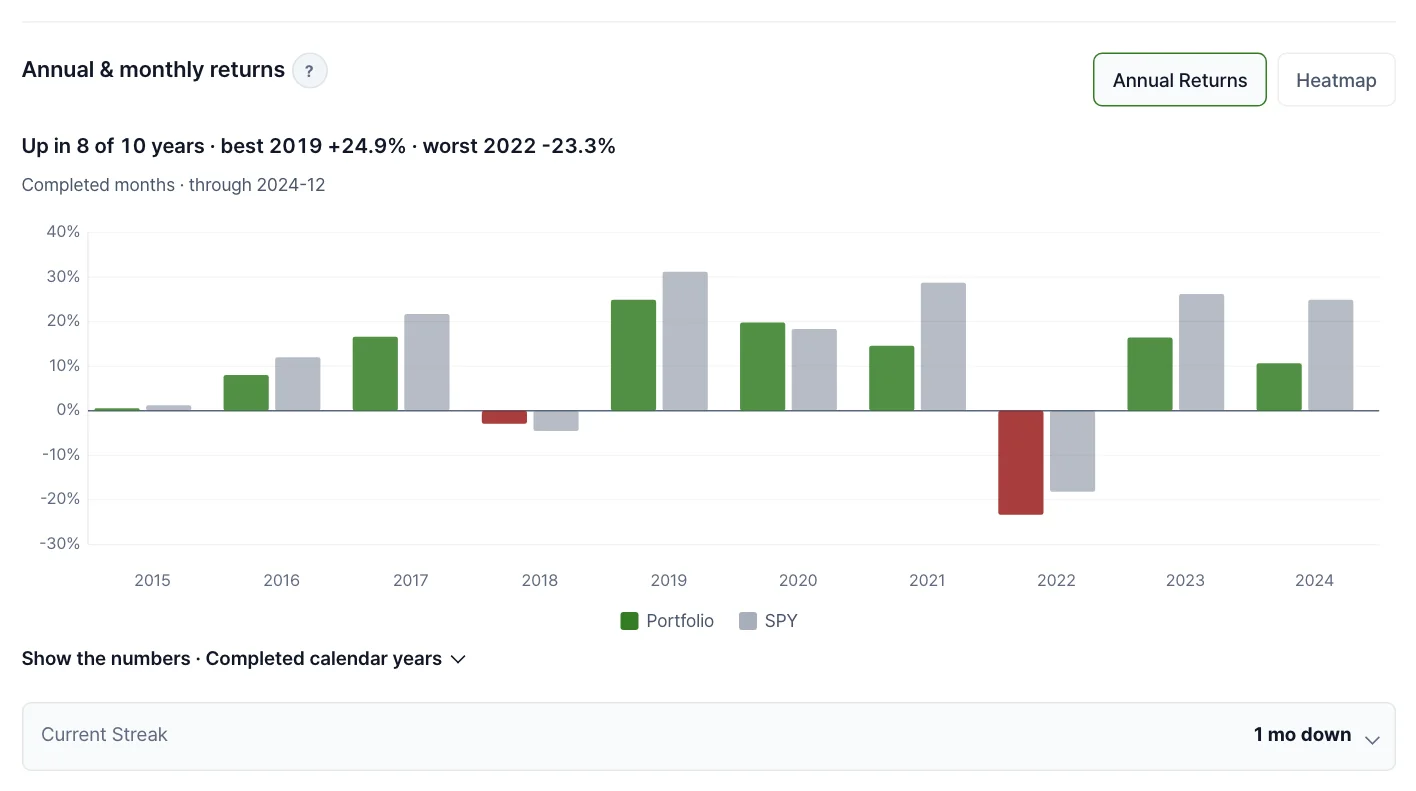
Annual & monthly returns opens on the annual bars. Click Heatmap to switch to a month-by-month grid. The summary line above the chart, "Up in 8 of 10 years · best 2019 +24.9% · worst 2022 −23.3%", counts only years with all twelve months of data.
Green bars are the portfolio (red in losing years) and gray bars are the benchmark. Go through the ten years one by one and green comes out ahead only twice, in 2018 and 2020. And 2022 is the only year in which the portfolio lost more than SPY.
Three takeaways from this result
First, it earned less than SPY but came through the 2020 crash with a much smaller loss. In Cumulative returns during crisis windows in the Risk & recovery section, the COVID-19 Crash (2020-02 to 2020-03) shows −16.2% for the portfolio and −33.7% for SPY. If the 60% in SPY had fallen that much and nothing else had moved, the portfolio would still have lost more than 20%, so the other 40%, in TLT, must have offset part of the loss.
Second, in 2022 that cushion disappeared. The portfolio returned −23.31% for 2022, a bigger loss than SPY's −18.17%. The reason a portfolio with 60% in SPY lost more than SPY itself is TLT: expand Asset performance details in the Assets & diversification section, and Annual Returns per Asset shows TLT returned −31.24% that year, far worse than SPY.
| Window | Portfolio | SPY |
|---|---|---|
| 2020 full year | +19.82% | +18.37% |
| COVID-19 Crash (2020-02 to 2020-03) | −16.2% | −33.7% |
| 2022 full year | −23.31% | −18.17% |
| 2022 Rate Hike Bear Market (2022-01 to 2022-10) | −26.3% | −24.5% |
The same 60/40 mix beat SPY in 2020, both in the crisis window and for the full year, and trailed it on both counts in 2022. The comparison across all three crisis windows, and what to make of it, is in The limits of backtesting.
Third, over the full 10 years its risk-adjusted return was also lower than SPY's. The Sharpe ratios in the vs SPY section's metric comparison, 0.55 versus 0.76, mean it earned less excess return over the risk-free rate for the volatility it took on. Keep in mind that this conclusion holds for this particular period, which includes 2022–2024.
Four checks to run on your own results
These aren't rules for deciding what to buy. They are ways to read a result you ran yourself without leaning on any single card.
- Rerun with the end date 1–3 years earlier. This shows how much the result depends on where the period ends. End this example at the end of 2021 and the cards change to an annualized return of +11.3%, a max drawdown of −18.5% and a loss after a 1-year hold of 5%, 4 of 73 windows (open the version that ends in 2021). Why a single date can move the numbers this much is explained in The limits of backtesting.
- Compare against a benchmark run on the same settings. An annualized return on its own doesn't tell you whether it's high or low. The "5.4pp behind SPY" on card ②, the "SPY 15%" on card ④ and the first line of the vs SPY section, "The same money in SPY would have grown to $33,969", are all calculated over the same period and in the same currency, so they make a fairer comparison than numbers you've seen on another site or for a different period.
- Read the daily MDD alongside the peak-to-recovery time. A drop that recovers within a few months is not the same as one that takes years. In this example, the 2020 drop (−18.5%) was two-thirds as deep as the 2022 one, but the Recovery Timeline in the Risk & recovery section shows it took just 103 days from peak to recovery, a little over a tenth as long as 2022's 990 days.
- Check the loss share over longer holding periods. Card ④ covers only 1-year holds. Holding-period outcomes in the Performance section slides 1-, 3-, 5-, 7- and 10-year windows forward one month at a time and, for each holding period, shows the worst and best annualized return and the share of windows that ended in a loss. Only holding periods with two or more windows appear, so this example shows 1, 3, 5 and 7 years. In this example, 16.5% of 1-year holding periods (18 of 109 windows) and 5.9% of 3-year holding periods (5 of 85) lost money, and none did from five years on. Why that share isn't a probability of loss is also covered in The limits of backtesting.
If you add contributions and the two returns diverge, an extra line such as "Counting when you added money: +7.5%" appears under card ②. This money-weighted return also reflects when and how much you invested. For how it differs from the annualized return, see TWRR and MWRR.
None of these checks predicts what happens next. The formulas are in Methodology, and the price, dividend and interest-rate data are described in Data Sources.
Frequently asked questions
What's the difference between annualized return and cumulative return?
Cumulative return is how much the money grew over the whole period. Annualized return is the constant yearly rate that would produce the same growth. In the All metrics window, the example's cumulative return is +108.52%, which works out to 7.63% a year compounded over 10 years. If the period is shorter than a year, card ② shows the cumulative return without annualizing it, because stretching three months of performance into a full year produces a number that never actually happened.
Why is SPY the default benchmark?
SPY is the default because it is an ETF that tracks the S&P 500, which makes it a convenient yardstick for the US stock market. You don't have to compare against it, though. Expand Advanced settings and, under Benchmark, pick QQQ, BND, GLD, VT or EWY, or type in a ticker of your own. Choose None to turn the comparison off. Change it and rerun, and the comparison line on card ②, the benchmark share on card ④ and the vs SPY section all switch to the new benchmark.
Will I get the same results every time I run a backtest?
The same settings give the same results. Nothing in the summary cards or the chart calculations is random. The exception is the Scenarios section, which builds possible outcomes by randomly resampling and stitching together past monthly returns, so it comes out slightly different on each run. Also, if price or dividend data arrives late or is corrected, the numbers for any period that includes those dates can change, especially for the most recent stretch.
The numbers in this article were verified by rerunning the same settings on Nov 6, 2026. If you spot an error, please let us know using the Send Feedback button at the bottom right of the screen.