
Backtest · Optimizer · Rankings · FIRE calculator · Lifestyle
Backtest your ETF, stock and crypto portfolio first
See returns, drawdowns and recovery side by side.
Free, no sign-up · Save results as a link
Example result
SPY 60 · TLT 40 vs SPY
- Annualized return
- 7.6%
- SPY 13.0%
- Max drawdown · daily
- −27.6%
- Month-end −26.2%
- Sharpe Ratio
- 0.55
- SPY 0.76
- Recovery
- 23 months
- From the deepest point back to the peak
- 2015.01–2024.12
- No contributions
- Monthly rebalancing
- Dividends reinvested
- In USD
The deepest fall came in 2022, −27.6%, and took 23 months to recover. Past results do not guarantee future returns.
What do you want to find out?
Each question opens its tool.
Weight optimizer
Change only the weights, get a different result
Find weight candidates from return, volatility and correlation, and compare them with your current mix.
- 6 methods, incl. max Sharpe
- Efficient frontier
- Compare with your current mix
| Asset | Equal Weight | Min Volatility |
|---|---|---|
| SPY | 50% | 43% |
| TLT | 50% | 57% |
Strategy Rankings
Curated strategies, compared the same way
Compare popular mixes and curated strategies by annualized return, max drawdown and Sharpe ratio.
- Tabs by period and purpose
- CAGR, MDD and Sharpe in one table
- Data date and test period shown
| Portfolio | CAGR | MDD | Sharpe |
|---|---|---|---|
| DGRO 30 · SCHD 40 · VIG 30 3 ETFs | 10.9% | −17.9% | 0.53 |
| GLD 25 · SHV 25 · SPY 25 · TLT 25 4 ETFs | 6.2% | −16.2% | 0.29 |
| SPY 60 · TLT 40 2 ETFs | 3.9% | −26.2% | 0.06 |
| DBC 7.5 · GLD 7.5 · IEF 15 · TLT 40 · VTI 30 5 ETFs | 2.2% | −22.2% | −0.11 |
FIRE Calculator
At this pace, when could you retire?
Estimate your retirement age and the assets you need from your savings, monthly investment and spending.
- Dividends vs withdrawals
- After-tax dividends (15.4%)
- Continue to living costs
Result with the FIRE calculator defaults
FIRE at about 61
About 25.7 years from now · 2052
- Assets needed
- ₩900M
₩3M a month · in today's money
Depending on returns, 57 (optimistic) to 66 (conservative)
Age 35 · ₩10M plus ₩1M a month · 11% a year assumed · SCHD 50 · VIG 25 · DGRO 25
Living Costs
Cities your monthly budget covers
Split each city's living costs by category and compare them with your budget.
- Costs by category
- Comfortable, tight or short
- Compare up to 3 cities
1 person · ₩3M a month · balanced
- Chiang Mai Thailand ₩1.8M Comfortable
- Busan South Korea ₩3.1M Tight
- Seoul South Korea ₩4.4M Short
How it works
Three steps
-
Pick assets
Search ETFs and stocks, add them and set the weights.
Name or ticker- SPY 60%
- TLT 40%
-
Set the conditions
Pick the period, amounts, contributions and rebalancing.
- Period
- 2015.01–2024.12
- Starting amount
- $10,000
- Rebalancing
- Monthly rebalancing
- Dividends
- Dividends reinvested
-
Compare the results
Compare return, drawdown and recovery with a benchmark, then save the link.
Start from examples
Start with popular mixes
See the last five years, then recalculate with your own amount and period.
BND 25 · GLD 25 · VTI 25 · VXUS 25
Data as of 2026-10-31BND 25% · GLD 25% · VTI 25% · VXUS 25%
- Annualized return
- 9.1%
- Max drawdown · month-end
- −18.9%
Last 5 years · 2021.10–2026.10
View and recalculateSCHD 100
Data as of 2026-10-31SCHD 100%
- Annualized return
- 10.6%
- Max drawdown · month-end
- −15.7%
Last 5 years · 2021.10–2026.10
View and recalculateGLD 10 · QQQ 70 · TLT 20
Data as of 2026-10-31GLD 10% · QQQ 70% · TLT 20%
- Annualized return
- 9.4%
- Max drawdown · month-end
- −29.6%
Last 5 years · 2021.10–2026.10
View and recalculate
Popular ETF matchups
Backtests that answer a question
- How would regular investments of KRW 500,000 in the S&P 500 have grown?SPY 100% from 2016-01-04 to 2026-10-23, with KRW 500,000 initially and each month, reinvested dividends, and KRW reporting.
- How would reinvesting dividends affect regular investments in SCHD?SCHD 100% from 2012-01-03 to 2026-10-23, with KRW 10 million initially and KRW 500,000 monthly, reinvested dividends, and KRW reporting.
- What returns and drawdowns would a long holding period in a 3× semiconductor ETF have produced?SOXL 100% from 2010-04-01 to 2026-10-23, USD 10,000 initially, no contributions, reinvested dividends, and USD reporting.
Guides
Learn to read the results
One example, walked through the cards, drawdowns, currency and metrics.
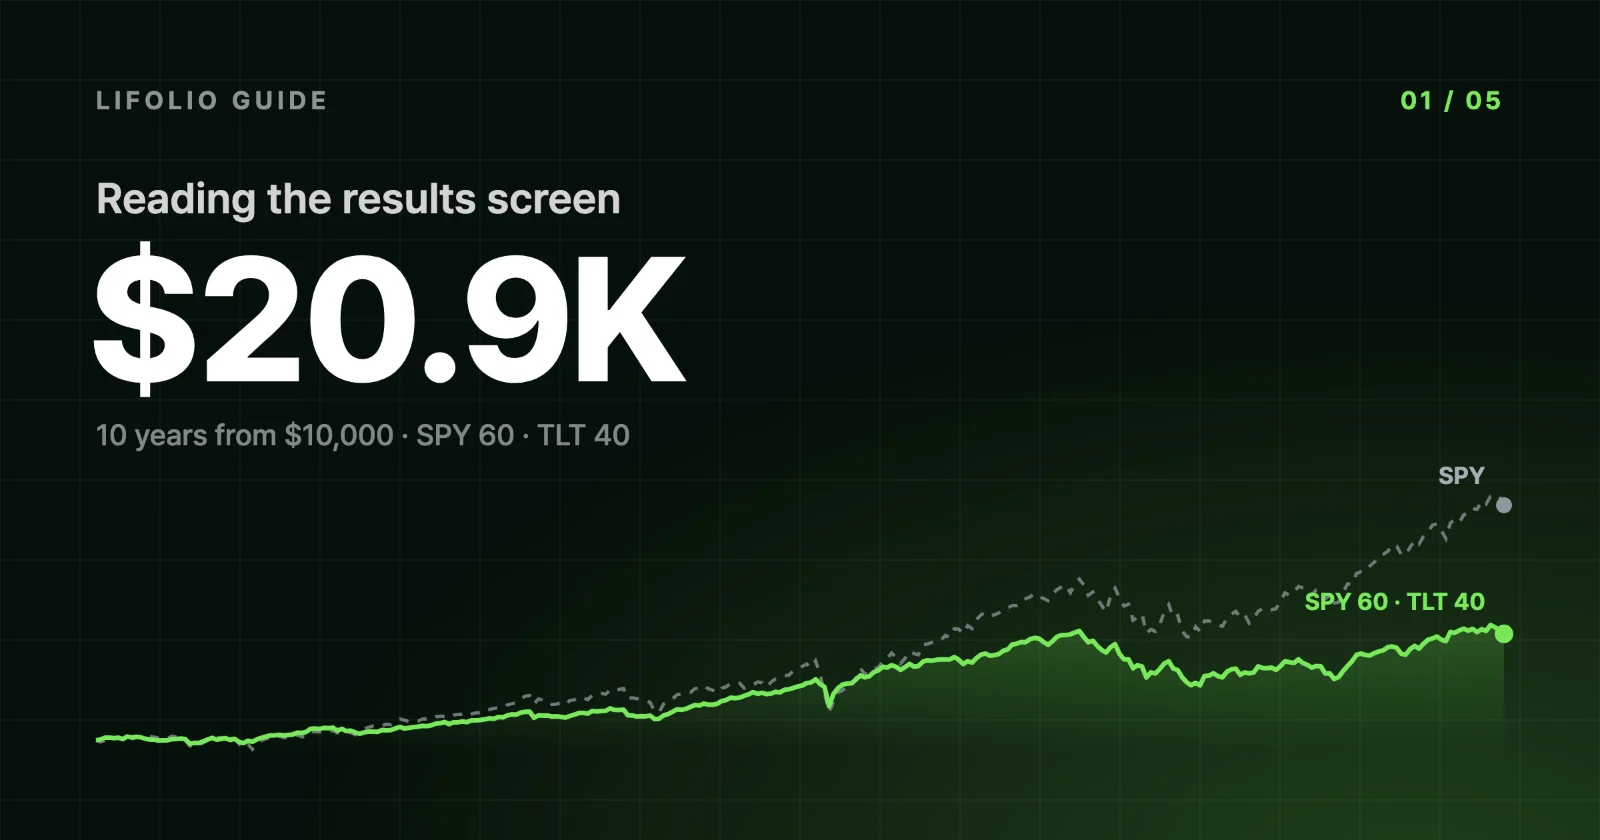 How to read backtest results: the four summary cards and the charts Read the Final Balance, CAGR, max drawdown and Loss after a 1-year hold cards and the charts below them, using a 10-year SPY/TLT backtest as the example.
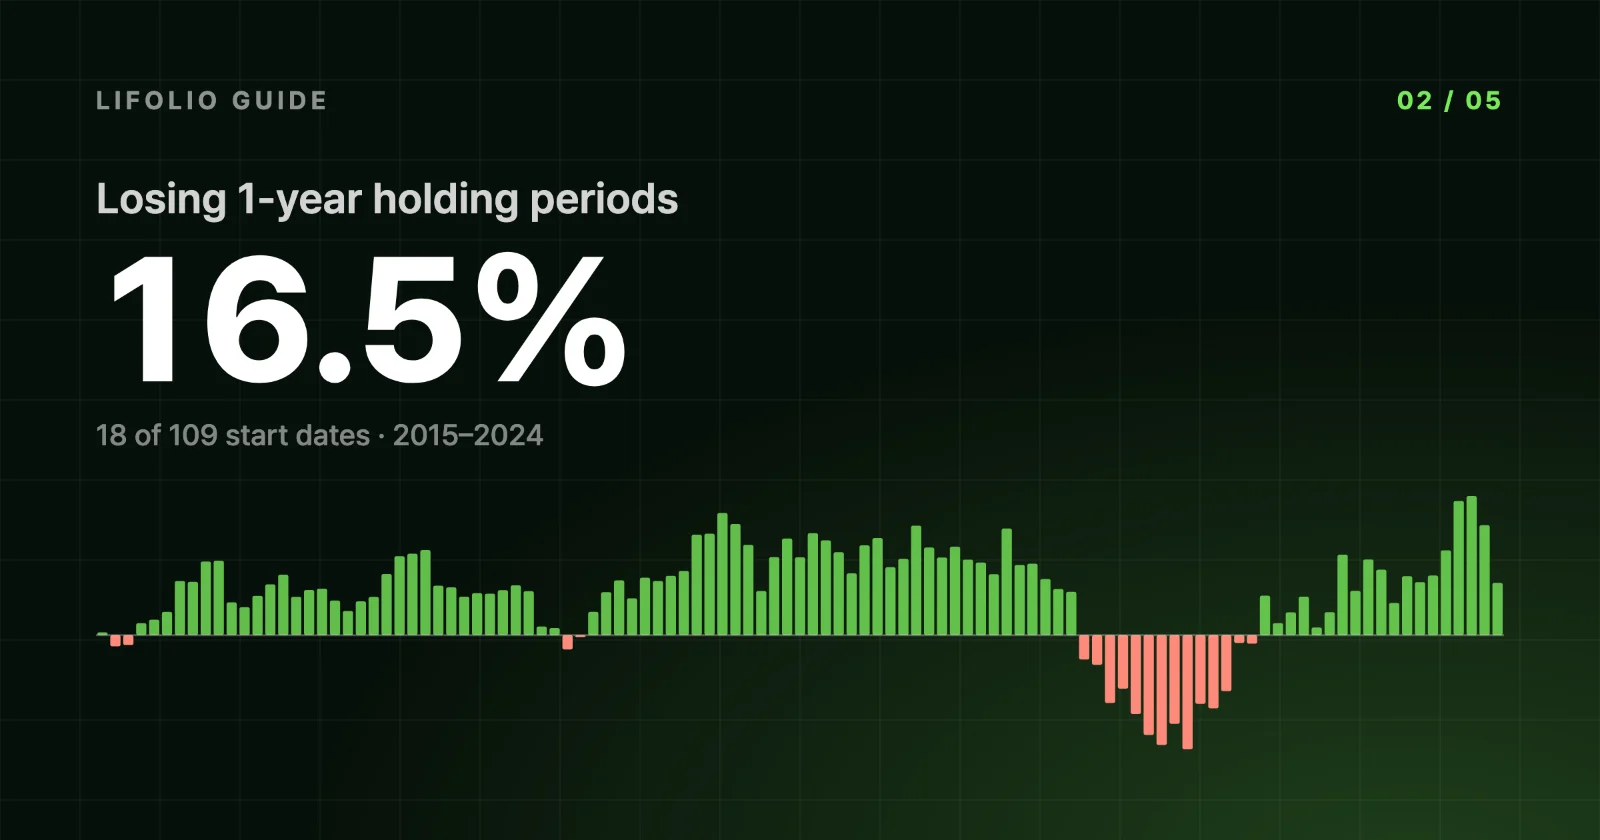 The limits of backtesting: why the date range you pick changes the result Ending three years later cut an SPY/TLT portfolio's annualized return from 11.26% to 7.63%. See how the date range, holding period and crises shift backtests.
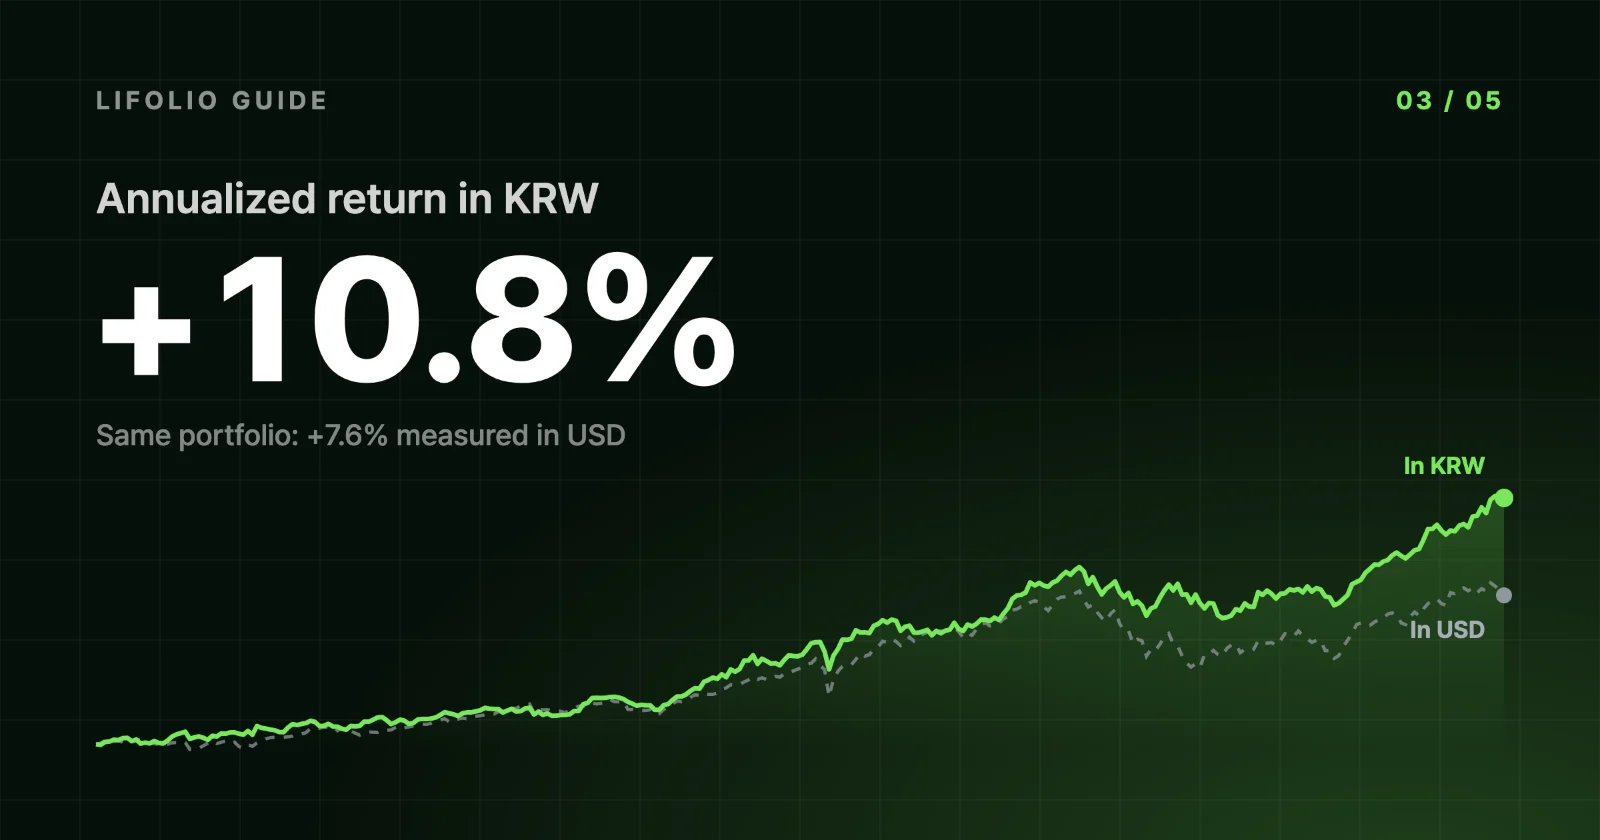 Why KRW returns differ from USD returns An SPY 60%/TLT 40% portfolio returned 7.6% a year in dollars but 10.8% in won. Actual 2015–2024 exchange rates show why returns and drawdowns diverged.
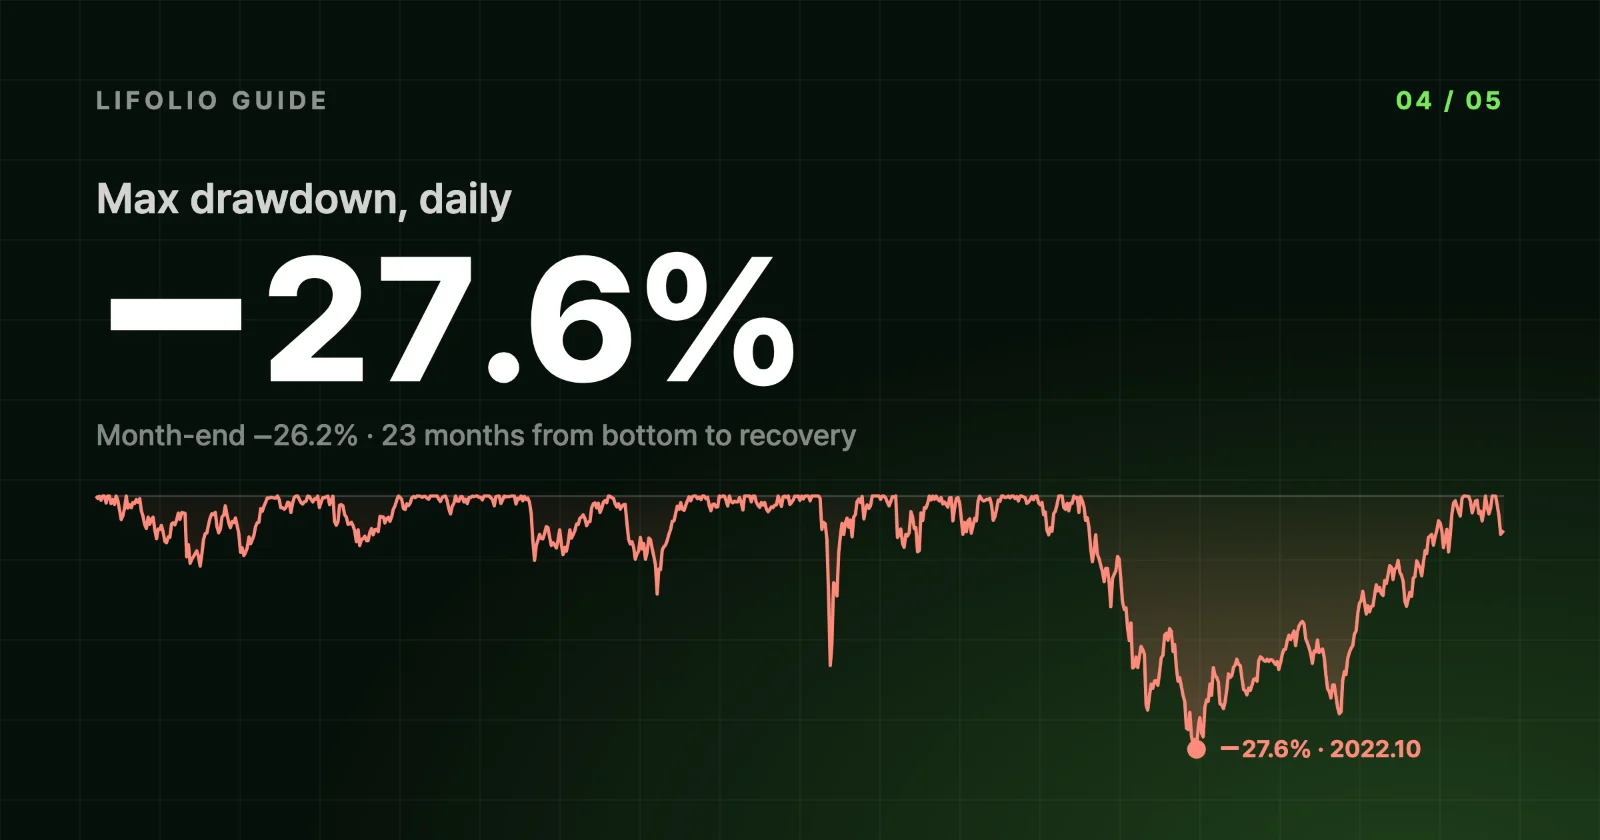 Maximum drawdown (MDD) explained: daily vs month-end MDD and recovery time MDD is the largest drop from a peak. Real numbers show why daily and month-end MDD differ for the same portfolio, and what 23 months and 990 days each measure.
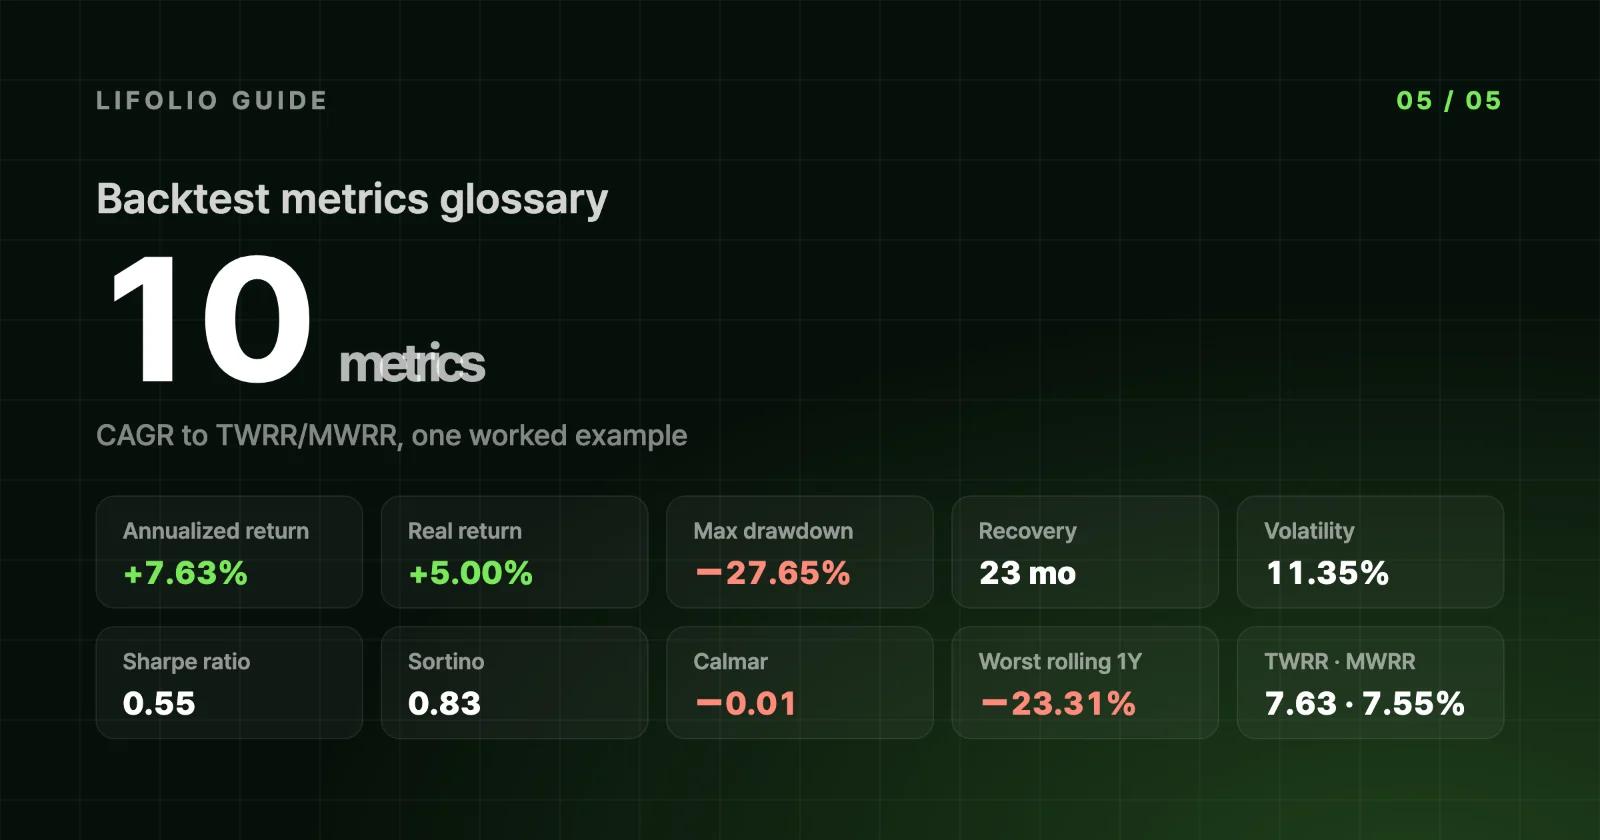 Backtest metrics glossary: CAGR, MDD, Sharpe and Calmar ratios explained What CAGR, real return, MDD, volatility, Sharpe, Sortino, Calmar and TWRR/MWRR measure, with example values, how Lifolio calculates them and common pitfalls.
Evidence and transparency
Every number shows its basis
Each result comes with the data and assumptions behind it.
What Lifolio does not do
- Recommend individual stocks or when to trade.
- Promise future returns based on past results.
- Ask for a login or personal data to calculate.
Built and run by the Lifolio operator · first deployed April 2026
Errors and ideas: the chat bubble button (“Send Feedback”) at the bottom right. Business: business@lifolio.io
-
Open data sources
We publish who provides the price and distribution data, how often it updates and how it is processed.
View data sources -
Open methodology
We explain how annualized return, max drawdown and Sharpe ratio are defined, and the rebalancing and risk-free rate assumptions.
View methodology -
Settings next to results
Period, currency, dividend reinvestment and benchmark are shown with every result.
-
Not investment advice
All results are for education and reference. You make the final investment decision.
View disclaimer
Frequently asked questions
Is it free? Do I need an account?
Every feature is free, and you can calculate right away without signing up or logging in. Ads, if shown, never change results or rankings.
What can I put in a portfolio?
US-listed ETFs, Korea-listed ETFs such as KODEX and TIGER, US and Korean stocks, coins such as Bitcoin and Ether, and apartments in Seoul and Bundang, all in one portfolio. Leveraged ETFs such as QLD, TQQQ, SOXL and KODEX Leverage are included.
How far back can I go?
Each asset starts on its listing date. With several assets, the backtest starts on the first day they all traded, and the years before a listing are not filled in from an index. KRW results, or portfolios mixing KRW and USD assets, start no earlier than December 2003, when the exchange-rate data begins.
View data sourcesHow are dividends and fees handled?
Dividends are reinvested in the same asset by default; turn this off to hold them as cash that earns no interest. Backtests do not deduct trading fees or taxes, so a real account would earn somewhat less. ETF expense ratios are already reflected in ETF prices, so they are not deducted again.
View methodologyCan I see results in KRW?
Yes. Results are in USD by default; switch the currency to KRW and USD assets are converted at each day’s USD/KRW rate. The same mix can then return more or less, by as much as the exchange rate moved.
Guide: why KRW returns differ from USDWhat is max drawdown measured from?
From the previous peak, not from what you put in: it is the largest fall from a high. Backtest result cards use daily closes while the portfolio list and ranking use month-end values, so the same mix can show slightly different numbers.
Guide: daily vs month-end max drawdownCan I save or share results?
The share button on the results screen makes a link that holds your settings and reopens them. You can also save up to 30 named backtests in this browser.
Will I earn what the backtest shows?
No. A backtest is a simulation on past data, so the same mix can have different returns and drawdowns in the future. Results can also change a lot with the period, so check several periods.
Guide: the limits of backtestingAnything else? Ask with the chat bubble button (“Send Feedback”) at the bottom right.
Got a mix in mind? Run it now
Save and share settings and results as a link.